Anything that exists can be measured
Out of all the thousands of pages of all of the textbooks you ever read in your life, how many sentences can you remember? One that has remained with me for over twenty years was in the required book for my inferential statistics course,
“If something exists, it must exist in some quantity and that quantity can be measured.”
 A lot of people disagree with that idea and there are whole volumes written about how people like me are backward neanderthals. In addition to the redundancy of “backward neanderthal” (is there a “progressive neanderthal”), this is factually incorrect as one can see by the pictures I have helpfully provided of a neanderthal and me.
  The one wearing sunglasses is not the neanderthal.
To me, the whole idea of measurement is fascinating. The belief that everything from how good of a mother you are to the love you have for your spouse to intelligence can be somehow reduced to a number strikes some people like a science fiction story.
Let’s think about how this can really be done. Let’s take “a good family”, how could you possibly measure if someone comes from a good family?
You’d start with asking questions, and there really is a limited set of questions that most people would agree upon. Few people outside of mental institutions would ask such questions as:
Do you own a kazoo?
How many grapefruits are in your refrigerator?
What color is your llama?
Many more people would ask questions that sound like good measures, such as:
How often do you read to your child?
Do you sing songs to your child that teach patterns, like Ten Bears in a Bed?
Have you taken your child out somewhere in the past month (such as relative’s house, museum, church)?
Even if these questions sound good, they may not be good measures. Let’s assume we agree that not all families are equally good. Then a question that everyone answers the same is not a good question for our measure. So, we start with item analysis. First, we do a frequency distribution. If everyone gives the same answer, there must be something wrong with this question and we throw it out.
Second, we get the mean (average), standard deviation (the average difference from the mean) and graph the frequency distribution. Below is a graph of some data I just happened to have laying around. This is one of the things I love about my life, that I just happen to have data laying around. Also the fact that I don’t know whether the correct word is ‘lying’ or ‘laying’. If this was The Phantom Tollbooth, I would SO be living in Digitopolis.
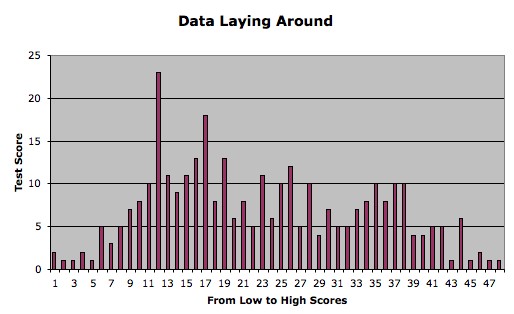
As you can see, there are not very many people with really low scores and not very many people with really high scores. Most people fall in the middle range and that is what we would expect. As I tell my children all the time, “No one has a perfect family, so shut up.” If there are perfect families, there are few of them. There are also very few truly horrible families where children are kept in cages and force-fed mud. Even in the middle, we expect some variation. Some families are a little better than average, some are a little worse.
When we have a few hundred scores like this, it is useful to just stare at the data. It is also helpful to take a look at the numbers – what is the mean, what is the standard deviation, the minimum and the maximum? If the average was 42 and the maximum was 300,000,000 I think I would wonder whether this was a valid measure of quality of family life. Instead, I think it might be a measure of how much the family owns in stock, for example, which I don’t think is the same as how good your family is, no matter what some Republicans might think.
This is just the beginning. Once we have computed item level statistics and examined the mean, variance and distribution of the total score – wait! there’s more. That will have to wait until another day
I don’t think you are one of those people that was meant to experience retirement. You’re measuring “good families” for crying out loud!
I worked for a prof. who had a company that evaluated all kinds of things for other entities, which looks like it’s right up your alley.
Do you think their should be some imput from members of the family, particularly children? How does a mother who says to her children, “If you don’t win we’ll still love you, just not as much,” get scored in your survey of questions? 😉
I think a mother who says, “If you don’t win, we’ll still love you, just not as much” – should get EXTRA points for having a sense of humor!
Yes, I think a really comprehensive measure of families should include measures from multiple family members. Some, like the FACES (Family Adaptability and Cohesion Evaluation Scales) do just like.
I worked with said prof. on the same survey for 4 years, and every year, she’d have a new variable for me to code and enter. By the time the final report was due, she had so much data that she didn’t know what to do with it. I think she got an extra journal article out of it before she threw it away. I didn’t mind, b/c I got paid per hour!
It seems that neither of you can turn off your brains. Are you so bored yet you have to go back to work b/c you don’t know what to do with yourself? I bet you’ll start another blog before the end of the month. Oh well, at least I’ll have something else to read! 😀
It is quite refreshing to see empiricism alive and well. I’ve been in school or practiced clinical psychology since 1970.
My major professor was John B. Wolfe. He conducted very early research on secondary reinforcement. He and his wife, Dr. Lilian Wolfe, made me an empiricist/behaviorist for life.
Thank you for your work, Jack
Who said it? If it exists it can be measured
Who actually said, “Anything that exists can be measured.”
I read it in one of my statistics books back in graduate school. It was attributed to Sir Francis Galton
Edward Thorndike