Two Useful Resources for Teaching University Statistics Courses
The Mplus website has free videos on using Mplus. The introductory course (not very introductory, really, because the the main topics are advanced factor analysis and structural equation modeling) has some pretty good resources. While it is not professional quality – just a video of a class – and much of it is beyond the first or second statistics course most students take, about 22 minutes into the first course it has a very nice discussion of regression and an example with a dummy variable. Think I’ll use that part for my next class.
There is also a good introductory discussion of path analysis in the same video at about 27 minutes. The reason I’m giving the points in the video is that it is VERY long and much of it is kind of irrelevant – why Mplus came about – or too advanced for introductory graduate courses.
The Inter-university Consortium for Political and Social Research has a wealth of resources. The one I have used the most in the past is data that you can download. However, you can also select a study and perform simple cross-tabulations. For example, I used the 500 Family Study to create a table of the frequency with which a respondent attended religious services with a child by the family’s religion, controlling for relationship of the respondent. I was assuming mothers would attend services with their children more often than fathers. I had no idea whether there were differences among religions – well, it turns out there are pretty dramatic differences.
You can use ICPSR not only to statistically answer questions, but also to look at the statistical methods themselves. For example, I did a cross-tabulation of age and sex using the Kaiser-Permanente study of the oldest old. Each analysis produces both a table and a graph and here is the graph this one produced.
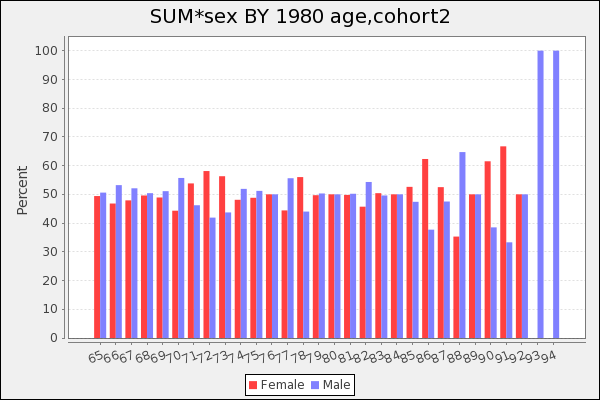
Now, we know that women live longer than men, but in this study we see there isn’t a real trend of males going down as a percentage as the age moves from 65 years on the left to 94 years on the right. In fact, 100% of the subjects over 92 years old were male. What does this tell you? Well, hopefully, after some discussion it will tell your students that this was not a random sample. In fact, it looks more like they deliberately sampled to get close to equal numbers of males and females, possibly within an age range, such as 80 to 90. It also suggests that there probably weren’t too many people over 92 years old in the sample. That finding that 100% of this age group is male was probably based on three or four people. Having generated some hypotheses, you can go back to the ICPSR site and test them, requesting percentages for the row and total lets you know that 0.1% of the sample was over 92 years of age. Speaking of hypotheses, you can also got chi-square values, z-values and confidence intervals for your various research questions.
I like this site because unlike a lot of others that have pre-packaged and usually boring questions, “Will males choose red M& M’s more often than females?”, ICPSR has hundreds of studies with hundreds of thousands of variables, allowing students to pose questions that really interest them and find an answer.
Thanks for that! It’s just the answer I nedeed.