Item Difficulty Analysis in Six (or Fewer) Easy Steps
What is item difficulty analysis and how is it helpful?
Item difficulty analysis is simply examining what percentage of students answered each item correctly. Item difficulty analysis is one basic way to establish test validity. One would expect that items at the second-grade level would have the lowest level of difficulty, being answered by the largest percentage of our students, and at the other end, the items at the fifth-grade level would have the highest difficulty , and be answered correctly by the fewest students. Since the items are scored 0 = wrong, 1 = right, we can use the means to see what percentage of students answered correctly. A summary table can give you a nicely formatted table for a report but here we’re just exploring our data, so using the univariate statistics you already have as a result of a CHARACTERIZE DATA task in SAS Enterprise Guide is easier.
1. Click on the univariate statistics data set produced by the CHARACTERIZE DATA TASK to select it,
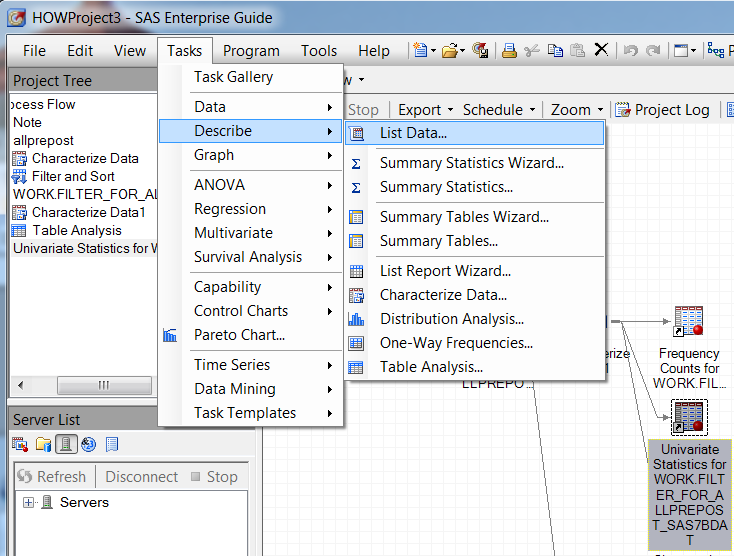
2. From the top menu, select TASKS > DESCRIBE > LIST
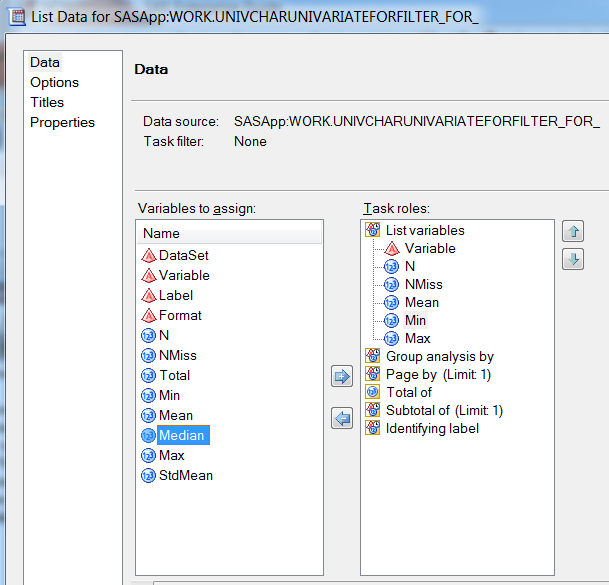
3. From the variables to assign pane, select the ones you want in your report, in this case Variable, N, NMISS, Mean, Min and Max.
 4. Select the records you want in your report. (If you want all of them, you can skip this step.) Now this part is a bit confusing because there is a variable named “variable”. Your univariate statistics data set has a column named ‘variable” and in it is the name of each variable for which you will be listing the N, NMISS, mean, etc. I only want the scored variables in my analysis, where they were scored 0 for incorrect and 1 for correct.
Click on EDIT from the button you can’t see in the screen shot above because I cut it off, but there really is an edit button, I promise. From the first drop down menu, select Variable, from the next select Not In A List, then click on the three dots to bring up a new window. In that window, click on the bottom left where it says Add Values. I selected q1 – q24,gender, missdata,age,pretotal, posttotal and usernum to drop. Click OK.
 5. Format the columns on your report. This part is also optional but I personally find it easier to scan through reports without six decimal places in every mean. So, I change the format by right-clicking on Mean and selecting Properties. I click the CHANGE button next to format.
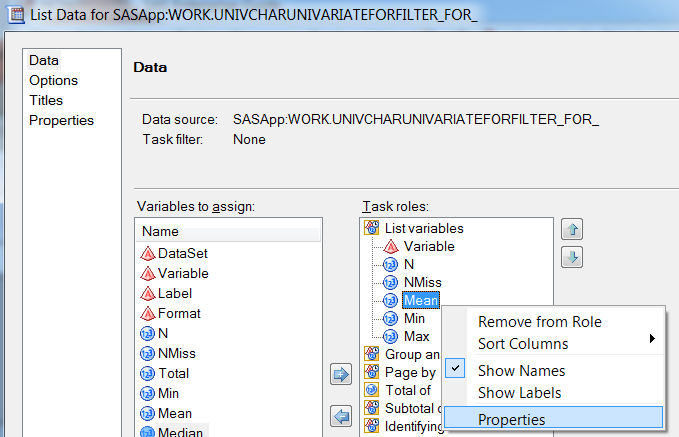
Then I click on Numeric for the format category, and scroll down to w.d. Under attributes, I put 8 for width and 2 for the number of decimal places. Then click OK.
6. Next, just to make the report even easier to read, I click Options and un-check the box next to Row Numbers
Click RUN to run the task
You don’t need to always export your output files to use them in some other program. I needed an xls file for an example, so at this point, I selected all of these data from the output open in Enterprise Guide and copied, and then pasted them into an OpenOffice Calc file (Excel would work just as well).
I sorted them in descending order and here is a partial picture of the result. I also changed the name from “variable” to “item” to make it less confusing.
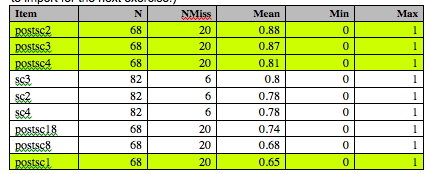
It’s clear that the post-test and pre-test do not have the same number of people, so I need to be cautious of comparing them directly. However, within test comparisons are fine. The test items are in order of grade level, beginning with second-grade level through fifth-grade. The first few items should be answered correctly by the most people. We can see that is true both for the post-test and pre-test, although it’s not perfect. Three items at the second-grade level were answered by over 80% of the students who took the post-test. We can also see that, generally, a higher percentage of students answered the post-test questions correctly than the pretest, as we would hope.
If you could scroll down to the bottom, you’d find that items 5 and 6 have some of the lowest percentage correct of any item, so I make another note to examine those items in more detail.
Have you tried the latest SAS Web Editor that was released in August? We now have tasks, including characterize data! Moreover, we have a guide for writing custom tasks that can be found at
“http://support.sas.com/documentation/cdl/en/webeditordg/66933/HTML/default/viewer.htm#titlepage.htm”
By next SGF (hope to see you there!) you’ll see a fusion of EG and Web Editor.
No, I haven’t tried it but that is really good to hear as I’m teaching an online class in November.