Data quality: data mining starts here
Yesterday, I wrote a little about beginning to analyze a data set from beta testing of our latest computer game, Spirit Lake. It will (I think) be one of a few data sets I use the first day of class.
Why am I going to spend the first class on data quality? In 30 years of statistical analysis and programming, I have never once regretted the time I spent in investigating data quality. The stories I could tell — let me it suffice to say that many academics go down the wrong road due to problems with the data they have collected and by the time they realize it, they are too far gone (they think, anyway). They have published the article, gotten the grant funds, submitted the final report – and so they don’t recant. Sometimes I am amazed that research ever finds anything true at all. As Thorndike once said about a study,
If the results bear any relationship at all to reality, it is indeed a fortunate coincidence.
To continue on the PROC FREQ … we assumed that students in the fourth and fifth grades would zip through the first level using second and third-grade math, but such does not appear to be the case.
I had done this step
proc freq data = test ;
tables quiztype*pass / out=quizfreq ;
and created an output data set, as well as a table, that showed which quizzes students took and whether they failed. I don’t think that table is very easy for the average person who is not familiar with the data to interpret, however, except that it shows that over half of the students – 56% – failed the quizzes. So, I did this step ….
Data test2 ;
set quizfreq ;
fail = substr(quiztype,1,4);
if fail in (“math”,”mult”) then fail = “Multiply” ;
else if fail = “divi” then fail = “Divide” ;
else if fail in(“peri”,”numb”) then fail = “Geometry” ;
I created a variable fail, which is the failure point in the game. When a student misses a problem, he or she is sent to take a quiz on that topic. There are quizzes on multiplying 3, 5, 6 etc. tables named things like multiply5. There is also a quiz in the game math2x which is one of our “casual games”. You get it right and you get a (virtual) puppy.
I use the SUBSTR function once to create a new variable that is the first 4 characters of the quiz name and then drop students into categories as to whether their failure occurred in Multiplication, Division or Geometry.
LESSON LEARNED
You may have to create your own variables and categories.
If you are particularly astute in studying the last post, you may have noticed that it is possible for the same student to appear twice – to fail at multiplication, then eventually pass that quiz and come back later to fail a problem on division. That did happen a few times.
The main question I want answered here, though, is where I need to focus our next game – should we be going up in grade level – I really want to do a game on statistics – or is the greatest need to build up those basic skills? For now, I think I want to keep the records where the same students fell out of the game more than once.
LESSON LEARNED
Know the question you are trying to answer and how the data could answer that.
Next I did this …
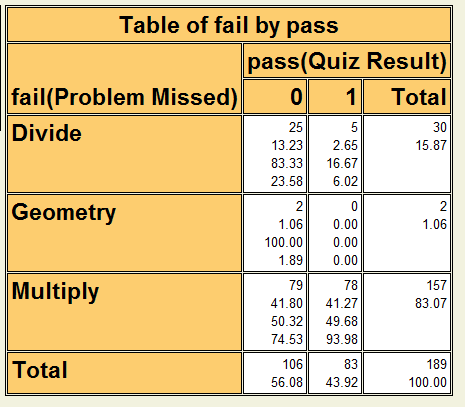
PROC FREQ DATA = test2 ;
TABLES fail*pass ;
WEIGHT count ;
LABEL
fail =”Problem Missed”
pass = “Quiz Result” ;
The label statement is because I had less than brilliantly named the variables pass and fail, which is kind confusing. Now I can see that 83% of the students missed at least one spot where they were expected to multiply and out of those students, about half failed the quiz. Another 16% of the students missed question asking them to divide and out of them, 83% failed the quiz.
Then, just because I thought it would be easier to visualize, I did this.
Title “Most common failure points – where students took quizzes” ;
Title2 “Each student counted only once” ;
proc gchart data = test2 ;
vbar fail / sumvar = count descending ;
I especially like the DESCENDING option because it shows the bars in descending order.

What this tells me already is that even though we have mostly fourth and fifth-graders, with a smattering of sixth-grade, most of the students who miss the problems are at a much lower level. In fact, we have almost no data at the fifth-grade level questions – the geometry items are simple ones on reading a number line and calculating perimeter.
This validates what the teachers told us, that in an average year, they may have at most one student who is at grade level.
Many things to think about here …