Reports of The Death of Theory Have Been Greatly Exaggerated
I’m about to tear my hair out. I’ve been reading this statistics textbook which shall remain nameless, ostensibly a book for graduate students in computer science, engineering and similar subjects. The presumption is that at the end of the course students will be able to compute and interpret a factor analysis, MANOVA and other multivariate statistics. The text spends 90% of the space discussing the mathematics in computing the results, 10% discussing the code to get these statistics and 0% discussing decisions one makes in selection of communality estimates, rotation, post hoc tests or anything else.
In short, the book is entirely devoted to explaining the part that the computer does for you that students will never need to do and 10% or less on the decisions and interpretation that they will spend their careers doing. One might argue that it is good to understand what is going on “under the hood” and I’m certainly not going to argue against that but there is a limit on how much can be taught in any one course and I would argue very strenuously that there needs to be a much greater emphasis on the part the computer cannot do for you.
There was an interesting article in Wired a few years ago on The End of Theory, saying that we now have immediate access to so much data that we can use “brute force”. We can throw the data into computers and “find patterns where science cannot.”
Um. Maybe not.
Let’s take an example I was working on today, from the California Health Interview Survey. There are 47,000+ subjects but it wouldn’t matter if there were 47 million. There are also over 500 variables measured on these 47,000 people. That’s over 23,000,000 pieces of data. Not huge by some standards, but not exactly chicken feed, either.
Let’s say that I want to do a factor analysis, which I do. By some theory – or whatever that word is we’re using instead of theory – I could just dump all of the variables into an analysis and magically factors would come out, if I did it often enough. So, I did that and came up with results that meant absolutely nothing because the whole premise was so stupid.
Here are a couple of problems
1. The CHIS includes a lot of different types of variables, sample weights, coding for race and ethnic categories, dozens of items on treatment of asthma, diabetes or heart disease, dozens more items on access to health care. Theoretically (or computationally, I guess the new word is), one could run an analysis and we would get factors of asthma treatment, health care access, etc. Well, except I don’t really see that the variables that are not on a numeric scale are going to be anything but noise. What the heck does racesex coded as 1= “Latin male”, 10 = “African American male” etc. ever load on as a factor?
2. LOTS of the variables are coded with -1 as inapplicable. For example, “Have you had an asthma attack in the last 12 months?”
-1 = Inapplicable
1 = Yes
2 = N0
While this may not be theory, these two problems do suggest that some knowledge of your data is essential.
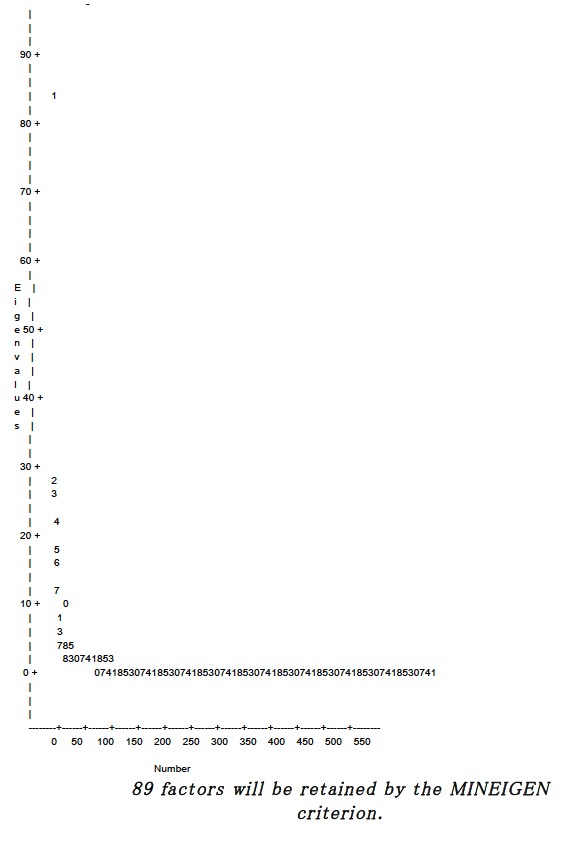
Once you get results, how do you interpret them? Using the default minimum eigenvalue of 1 criterion (which if all you learned in school was how to factor analyze a matrix using a pencil and a pad of paper, I guess you’d use the defaults), you get 89 factors. Here is my scree plot.
 I also got another 400+ pages of output that I won’t inflict on you.
What exactly is one supposed to do with 500 variables that load on 89 factors? Should we then factor analyze these factors to further reduce the dimensions? It would certainly be possible. All you’d need to do is output the factor scores on the 89 factors, and then do a factor analysis on that.
I would argue, though, and I would be right, that before you do any of that you need to actually put some thought into the selection of your variables and how they are coded.
Also, you should perhaps understand some of the implications of having variables measured on vastly different scales. As this handy page on item analysis points out,
“Bernstein (1988) states that the following simple examination should be mandatory: “When you have identified the salient items (variables) defining factors, compute the means and standard deviations of the items on each factor. If you find large differences in means, e.g., if you find one factor includes mostly items with high response levels, another with intermediate response levels, and a third with low response levels, there is strong reason to attribute the factors to statistical rather than to substantive bases” (p. 398).”
And hold that thought, because our analysis of the 517 or so variables provided a great example …. or would it be using some kind of theory to point that out? Stay tuned.