Messy Problems Made Simple with SAS
Some problems that seem really complex are quite simple when you look at them in the right way. Take this one, for example:
My hypothesis is that a major problem in math achievement is persistence. Students just give up at the first sign of trouble. I have three different data sets with student data from the Spirit Lake game. Many of the students in the student table are the control group, so they will have no data on game play. There is a table of answers to the math challenges and another table with answers to quizzes which students took only if they missed a math challenge. When students miss a math challenge in the game, depending on which educational resource they choose, they may do one of two or three different quizzes to get back into the game. Also, some of the quiz records were not from quizzes actually in the game but from supplemental activities we provided. So, how do I identify where in the process students drop out and present in a simple graphic to discuss with schools? Just to complicate matters, the username was different lengths in the different datasets and the variable for timestamp also had different names.
It turns out, the problem was not that difficult.
- Merge the student table with the answers (math challenges) and only include those students with at least one answer.
- Merge the student table with the quizzes and only include those students with at least one quiz
- Concatenate the data sets from steps 1 & 2
- Create a new userid variable and set it equal to the username
- Create a new “entered” variable and set it equal to whichever of the datetime fields exists on that record
- Delete the quizzes not included in the game.
- Sort the dataset by userid and the date and time entered.
- Keep the last record for each userid. Now you have their last date of activity.
- If there is a value for the math challenge field then that is the name of the last activity, otherwise the quiz name is the name for the last activity.
- Use a PROC FORMAT to assign each activity a value equal to the step in the game.
- Do a PROC FREQ using that format and the order = FORMATTED option.
Once I had the frequencies, I just put them into a table in a word document and shaded the columns to match the percentage. There may be a way in SAS/Graph or something else to do this automatically, but honestly, the table took me two minutes once I had the data.
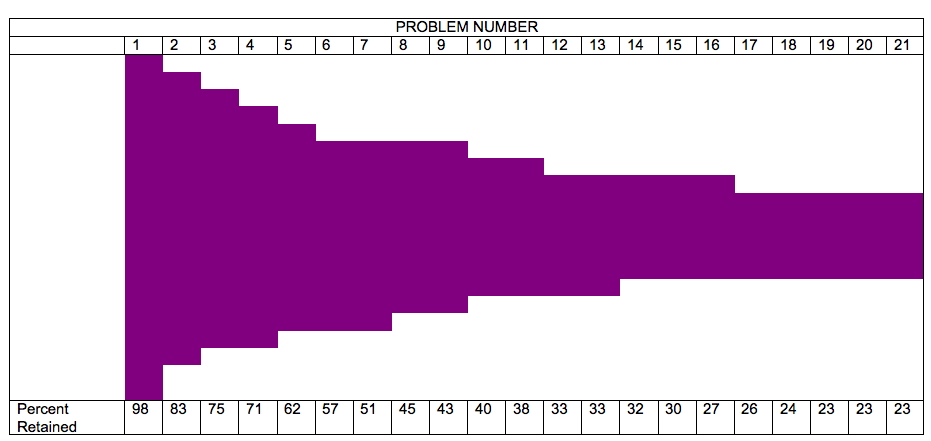
I think it illustrates my points pretty clearly, which are:
- A sizable number of students drop out after the second problem.
- 25% of the students drop after the first difficulty they have (missing the second problem)
- Only a minority of students persist all the way to the end, less than 25% of the total sample
This isn’t based on a tiny sample, either. The data above represent a sample of 397 students.
In case you would like to see it, the code for steps 3-11 is below. Particularly useful is the PROC FORMAT. Notice that you can have multiple values have the same format, which was important here because players can take multiple paths that are still the same step in the sequence.
data persist ;
attrib userid length= $49 ;
set mydata2.sl_answers mydata2.sl_quizzes ;
entered = max(date_answered_dt,date_taken_dt) ;
**** DELETES QUIZZES IN EXTRA AND SUMMER SITE, NOT IN MAIN GAME ;
if quiztype in (“problemsolve”,”divide1long”,”multiplyby23″) then delete ;
userid = new_username ;
format entered datetime20. ;
proc sort data=persist ;
by quiztype ;
proc sort data=persist ;
by userid entered ;
data retention ;
set persist ;
by userid ;
if last.userid ;
attrib last_activity length= $14 ;
if inputform ne “” then last_activity = inputform ;
else last_activity = quiztype ;
proc freq data= retention ;
tables last_activity ;
proc format ;
value
$activity
“findcepansi” = “01”
“x2x9” = “02”
“math2x” = “02”
“math2_2” = “02”
“wolves1a” = “02”
“multiplyby5” = “03”
“multiplyby4” = “03”
“multiplyby3” = “04”
“wolves1b” = “05”
…. AND SO ON ….
“horseform2” = “21”
;
ods rtf file = “C:\Users\Spirit Lake\phaseII\pipeline.rtf” ;
proc freq data= retention order=formatted ;
tables last_activity ;
format last_activity $activity. ;
run ;
ods rtf close ;
2 Comments