SAS Proc Transpose – how have I not written about this before?
When I was young and knew everything, I would frequently see procedures or statistics and think, “When am I ever going to use THAT?” That was my thought when I learned about this new procedure to transpose a data set. (It was new then. Keep in mind, I learned SAS when I was pregnant with my first child. She is now CEO of a an educational game company and the mother of three children. )
PROC TRANSPOSE is super-useful. You might only think it is useful for transforming data for use with PROC GLM to use with PROC MIXED, or you might have no idea what the hell that means and it is still super-useful.
Let me give you today’s example. I’m looking for data to use in a biostatistics class I’m teaching next month. It’s a small data set, with data on eight states included in the Center for Disease Control’s Autism and Developmental Disabilities Monitoring Network.
The data looks like this:
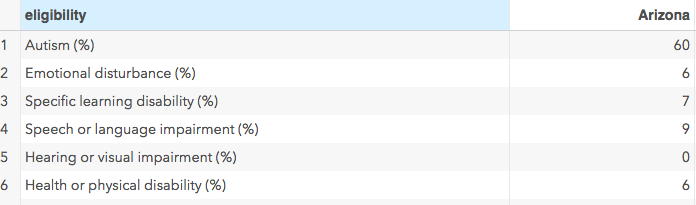
As you can see, each state is a column. I would like to know, for example, what percentage of people with autism also have a physical disability. There is a way to do it by finding the mean across variables but I want to use this data set for a few examples and it would be much easier for me if each of those categories was a variable.
The code is super simple:
PROC TRANSPOSE DATA=mydata.autism OUT=mydata.autism2 NAME=state;
ID eligibility ;
The NAME = option is not required nor is the ID statement but they will make your life easier. First, let’s take a look at our new data.
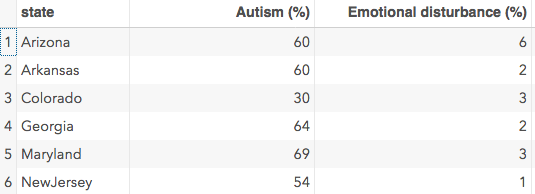
Now, instead of state being a variable, we have one record for each state, the percent with autism diagnosis only is one variable, percent with emotional disturbance another, and so on. What the NAME = option does is give a name to that new variable which was the name of each column. If you don’t use that option, the first column would be named _name_ . Now, with these data it would still be pretty obvious that this variable is the state but in some cases it wouldn’t be obvious at all.
The ID statement is really necessary in this case because otherwise each column is going to be named “COL1”, “COL2” etc. Personally, I found the ID statement here confusing because normally the ID statement I think of as the individual ID for each record, like a social security number or student ID. In this case, the variable name you give in the ID statement is going to be used to name the variables. So, as you can see above, the first column is named Autism(%), the second is named Emotional Disturbance (%) and so on.
So, that’s it. All I need to do to get means, standard deviation, minimum and maximum is :
PROC MEANS DATA =mydata.autism2;
So, that’s it.
By the way, I get this data set and a few others from SAS Curriculum Pathways. Nice source for small data sets to start off a course.
I live in opposite world, where my day job is making games and I teach statistics and write about programming for fun. You can check out our games here. You’re probably already pretty good with division but you’ll learn about the Lakota language and culture with Making Camp Lakota. A bilingual (English-Lakota) game that teaches math.