Baby steps to regression
What do you see when you look at a regression analysis? Because me, all I see is a bunch of numbers and I have no idea where to look first or what’s important. Could you start me off with regression in some baby steps? What is it that you are looking at when you stare at this stuff?
Never one to shy away from a student’s request, here you go. I had data from 104 people aged 16 -71 living on an American Indian reservation. All but 4 of them were over 18. I thought that there would be a NEGATIVE relationship between educational achievement and age given that the older people would have had fewer opportunities, for a lot of reasons.
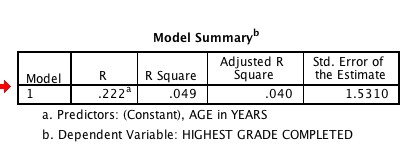
When I ran the regression, this was the first table I looked at.
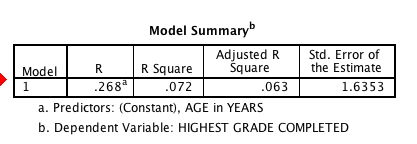
This tells me that the correlation between the years of education and education was .268. Since it is positive, I can already see my hypothesis is not supported. The R-square is the amount of explained variance – so, 7.2% of the variance in educational attainment in this adult population is explained by age.
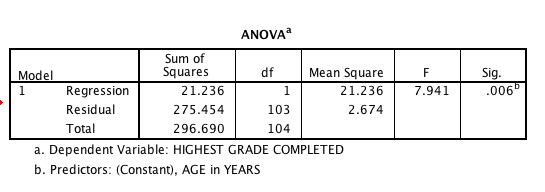
The ANOVA table tells me that my F-value is 7.94 and the probability of an F-value that large is less than .01 – in fact, it is .006. So, age is positively related, it explains about 7.2 % of the variance and this is statistically significant. If you divide the regression sum of squares by the total sum of squares you will find the quotient is .072. This is not coincidence.
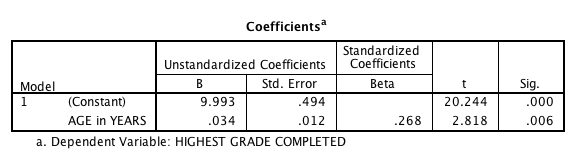
The intercept tells me what the value of education would be if age was zero, which is where the regression line intercepts the Y axis. The constant is 9.993. Children on the reservation really aren’t born with almost 10 years of education, which gives you some insight into the fact that you really shouldn’t interpret the intercept in cases where an X of 0 is not really feasible. I’m interested in educational attainment of ADULTS.
A more useful statistic is the standardized beta coefficient. In the case where you only have one predictor, this will always equal the correlation between the dependent and the independent. Of course, it is significant and at the same level as the overall model, since it is the only variable in the model. If you square the t-value of 2.818, you’ll see it equals 7.94. This isn’t a coincidence, either.
Okay, so we have a model that is significant, there is a positive relationship between age and education, with age explaining about 7% of the variance.
I always want to do some checks for possible outliers, so I graph the data like this:
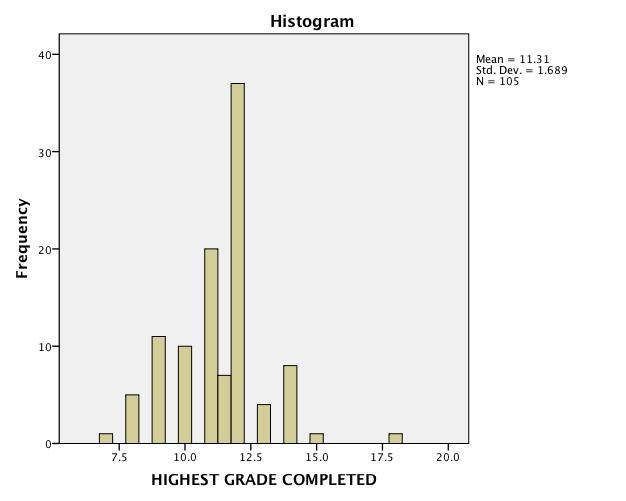 It’s a pretty skewed distribution, with that one person at the far right being four standard deviations above the mean for education.
 I also see, when I plot age by years of education that our one highly educated person is also over 60, so extreme in both ends.
I re-run the analysis without this one individual to see what happens. In fact, the regression is still significant, still positive but by dropping this one person the explained variance has dropped from 7.2% to 5%. (I could have looked at all of the same tables again, but you asked about a “quick and dirty” look, and I’d probably just glance at that one.)
You might think if I dropped one outlier and it made that much difference, maybe dropping the handful who were under 18 years of age would make a difference also. I did that, ran the regression again, and this time with 99 of my original 104 people the explained variance had dropped to 2.6% — so, by dropping out just five people, less than 5%, the explained variance is now one-third of what it was and my model is non-significant.
So …. hopefully this gives you a bit of insight into the first glances at a regression model and also the importance of not jumping up and running off as soon as you find a model with a significant F-value. Try to consider significance, explained variance, the standardized regression coefficient and the potential effect of outliers, for your first few baby steps.
This is so much easier to understand than our text book!!!