How to compute odds-ratios
A two-by-two table is a very common design. The column variable is some type of treatment or intervention. For example, older (over 65 years of age) people who either lived in a nursing home or who did not. Your row variable is some categorical outcome. For example, they either lived or died.
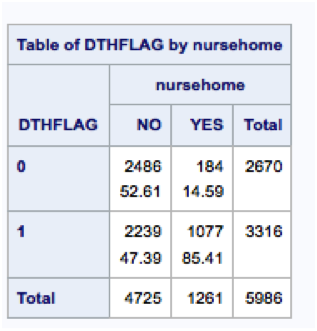
You create a lovely table, like the one below, that shows your number and proportion of people who did NOT live in nursing homes who lived (dthflag =0) and the N and proportion who died. It also shows the proportions and frequencies by status (lived or died) for those who did live in nursing homes.
With SAS, it’s easy.
PROC FREQ DATA = datasetname ;
TABLES nursehome*dthflag / CHISQ ;
will give you this nice table and it will even give you chi-square values (582.37 – though, really, with a chi-square over 500, the .37 is kind of redundant, don’t you think?) and a phi coefficient ( .31 in case you are dying to know). Since it is a two-by-two table, you automatically get a Fisher’s Exact Test also. You’d think anyone would be satisfied with that, but NO-O-O . Some people want odds ratios on top of it.
To compute the odds ratio you could divide the frequency row 1, column 1 by the frequency in row 2 column 2
2,846/184 = 13.51 — the odds of a person who lived not being in a nursing home versus being in a home.
Then you can divide the frequency in row 2, column 1 by the frequency in row 2, column 2
2,239/ 1,077 = 2.08
Then you can divide the odds obtained in the first row by the second
13.51/ 2.08 = 6.49
So, first of all, the odds someone who survived nine more years lived at home, versus in a nursing home, are 6.5 times the odds of someone who died during that period.
Or, you could skip all of that and just add the word MEASURES as an option in your TABLES statement, so it looks like this:
PROC FREQ DATA = datasetname ;
TABLES nursehome*dthflag / CHISQ MEASURES ;
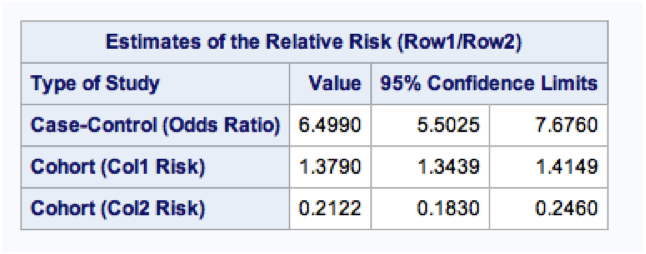
And, you could just look at the table produced when you use the measures option – it produces all types of other statistics, as shown below in one of the two tables simply typing the word MEASURES will get you. Here are our estimates of relative risk and Odds Ratio. People who died are a lot more likely to have lived in a nursing home.
It would be nice to have a test of statistical significance, wouldn’t it? Nicely, this same option gives you 95% confidence intervals. Since 1.0 does NOT fall within these confidence limits, you can safely say that the odds are significantly higher that a person who died would live in a nursing home than live at home.
And there you have it, a super-duper easy way to find the odds ratio.
Are you familiar with Tobit analysis? If so, I’d be interested to see a review of that in SAS.