Data quality – getting ready to teach data mining
Getting ready to teach a data mining course at the end of the year, I started looking through data sets I have on my desktop. Not sure what I will end up using. My first lesson, no matter what, is going to be on data quality.
The very first thing I did was a series of PROC FREQs. Then, I thought maybe that was a mistake. Perhaps I ought to start off with SAS Enterprise Guide or Enterprise Miner. Here is how I did the first peek at data quality with Base SAS. I’m going to do the same thing with Enterprise Guide tomorrow and see if it would be easier. After that, I’ll try Enterprise Miner. I know I downloaded the SAS On Demand version a while back and haven’t done much with it lately.
(There is a new SAS for the Web offering but from what I have seen (admittedly, a while back), it requires you to set up a virtual machine with VMware and I did not have the time to do it nor could I find my Windows 8 or Windows 7 install disk. Must clean office.)
The first thing I did was pull out a data set with a couple of thousand student quiz records. Yes, I know in data mining we will get to data sets in the millions but this is the first exercise of the first class.
I did not expect to have 2,000 quiz records because we only have around 1,200 beta testers and about 200 of those are teachers who I would expect would get all of the in-game problems correct so never be routed to a quiz. I also know from observation that some of the students never made it to the part of the game where they could do the quizzes. The first challenge page requires students to be able to read simple words and subtract two-digit numbers.
I did a super-simple PROC
proc freq data = in.realquiz ;
tables username*quiztype ;
and found that a couple of the users had supposedly taken the same quiz 40 or more times. One students showed having taken the quiz 70 times and another 91 times. While that is theoretically possible, I was suspicious because after those three, the highest number was 7.
I went into the data set and looked at those particular records and the time stamp showed them coming in tenths of a second apart. Clearly, the student was not answering 5-7 questions in less than a tenth of a second.
We tracked these down to a particular school that was having issues with the firewall. It appeared that when the program couldn’t connect to the server, it tried again and again. When there was a connection, all of those records went through at once.
LESSONS LEARNED
- Always look at the outliers. Don’t just toss them out. They can tell you things. In this case, taking a closer look at that PHP code is on my list of program fixes. If it happens at one school it can happen at others.
- Time stamps are your friend. I try to include them whenever I can. Yes, it might take up a bit of time and space but there is nothing like it for detecting duplicate records – and fraud.
- Just because data has supposedly been cleaned up, never, never assume that it is problem-free.
At the moment, we are interested in knowing the most common failure point in the games. Do we need to add in more teaching and problems earlier? The games are designed to teach and test students in mathematics at the fourth and fifth grade levels. The teachers we work with often tell us that their average student is below grade level. So here was my next series of steps.
proc sort data = in.realquiz ;
by username quiztype ;
data test ;
set in.realquiz ;
by username quiztype ;
if first.quiztype ;
*** These first steps sort the dataset by username and type of quiz and then only retain the first instance of each. So, if a student actually did take the same quiz seven times, I am only interested in the fact that beginning the game, he or she could not do multiples of 3, not that it took seven tries to get there.
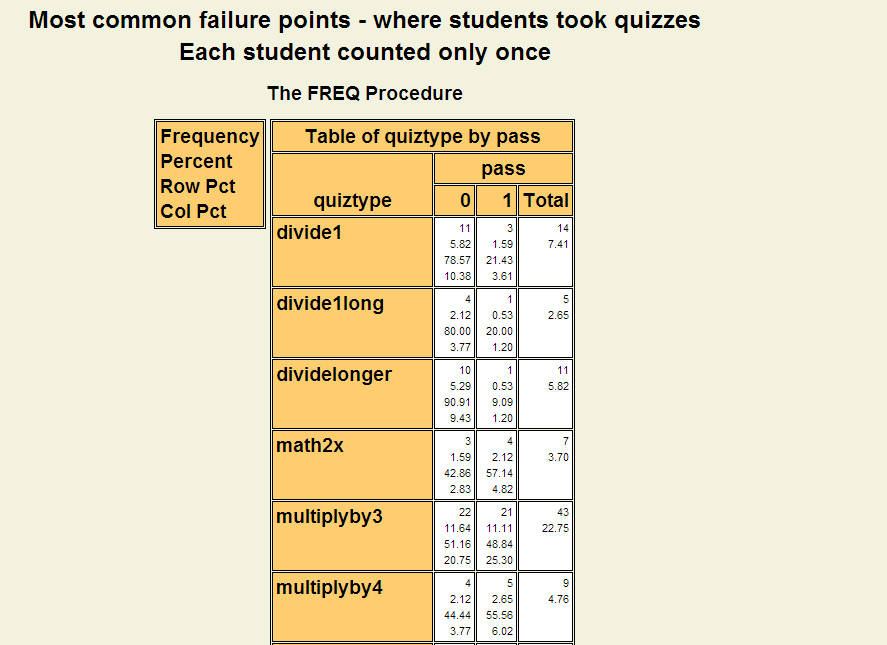
proc freq data = test ;
tables quiztype*pass / out=quizfreq ;
run;
*** This step shows both the quizzes students took and the result.
This is the point at which I began to become concerned, not about data quality but by what the data was beginning to reveal.
Visually impaired – click here for HTML files of tables instead of png
Over half of the students failed and the quizzes they were failing seemed to be at the lower levels – around third-grade math.
LESSON LEARNED
You can get some very valuable information from some very simple statistics. A lot more about that, tomorrow, though, since I have to get back to work ….