Maybe you *can* use SAS to teach art majors
I was supposed to be teaching statistics to undergraduate Fine Arts majors this semester but I’m going to Santiago to open a Latin American office for 7 Generation Games instead.
I’m a bit disappointed because even though when I was younger and got asked at cocktail parties what I did for a living, I would say,
I teach statistics to people who don’t want to learn it.
teaching Fine Arts majors would probably be a new experience.
I was planning on using Excel to teach that course. However, as I take a closer look at SAS Studio I think it might be feasible to use SAS.
First of all, it’s free for academics and you can use it on any device, including an iPad. I know because I’ve tested it.
Second, and more important for this group, you can use the tasks and do some real-life analyses with almost no coding.
For example, I want to know if the sample of students we tested on American Indian reservations who had a family member addicted to methamphetamine were, on the average, over the cutoff for depressive symptoms. On the scale we used, the CESD-C , the cutoff score is 15.
Step 1: Run the code to assign the directory with the data I made available for the course, for example,
libname in “/home/annmaria.demars/data_analysis_examples”;
run;
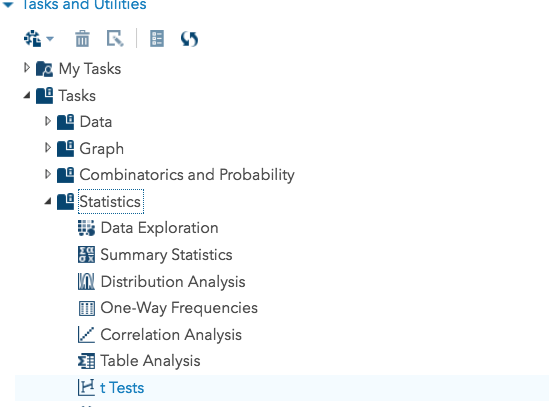
Step 2: Under the TASKS menu on the left select STATISTICS and then t TESTS
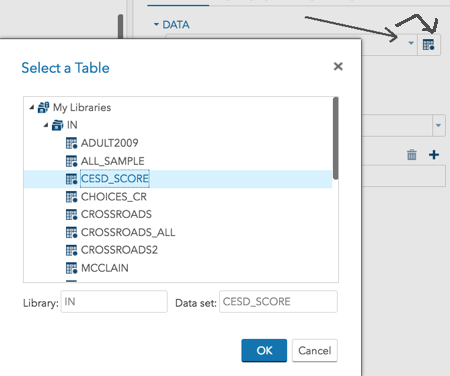
3. Next to the DATA field you’ll see a thing that looks kind of like a spreadsheet. It’s supposed to symbolize a data file. Click on that and a box will come up that lets you pick the directory (library) and the file within it. In my case, it is the CESD_score file.
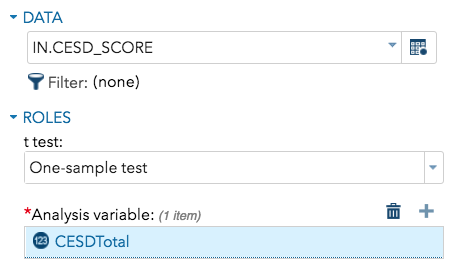
4. Now that I have my dataset selected, from the ROLES menu I select one-sample t-test.
5. Click the + next to Analysis Variable and select the dependent variable, in my case, this is CESDTotal
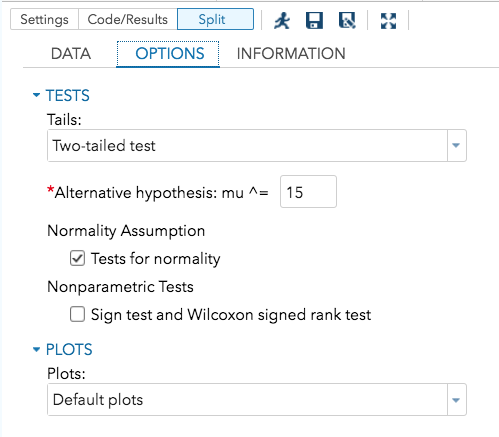
6. Now click on the OPTIONS tab. Two-tailed test is selected as the default. That’s good, leave it. The alternative hypothesis tested is usually that the mean is equal to 0, but I want to change that to 15. Just click the little running guy at the top to get results.
I showed the results in a previous post, the mean for my sample of 18 youth was 21 (p <.05).
What if we did an UPPER one-tailed t-test? Then my p-value is .015 instead of .03.
What if we did a LOWER one-tailed test? Then my p-value is 1.0.
To get these latter 2 tests takes about 5 seconds. All I need to do is change the option for tails and click on the running man again.
Now, in just a few minutes, I have data under three different assumptions, from an actual study. My students and I can start discussing what that means.
Bottom line, check out SAS Studio. It may be more of an option for your students than you think.