Interestingness from California data: One idea of many from WUSS
On my way home from the 2014 Western Users of SAS Software conference. When I was younger, I would go to every basic session trying to find something I could use that wasn’t over my head. As I got older, I went to the statistics sessions to see if there was anything new or more advanced I had not mastered yet.
Now that I’m really old, I just do my own presentations and then spend the rest of the conference wandering around to anything that looks interesting. Sometimes, the most interesting stuff is the questions after a session or just the random people I run into in the hallways.
Interesting stuff: Part 1 Data coolness
I had used the California Health Interview as example data for classes but I was not aware of the huge breadth of data available there. Also, if you are a researcher and ask them nicely they will create data sets for you, as long as the data are available and it can be done without violating confidentiality requirements. Check them out here.
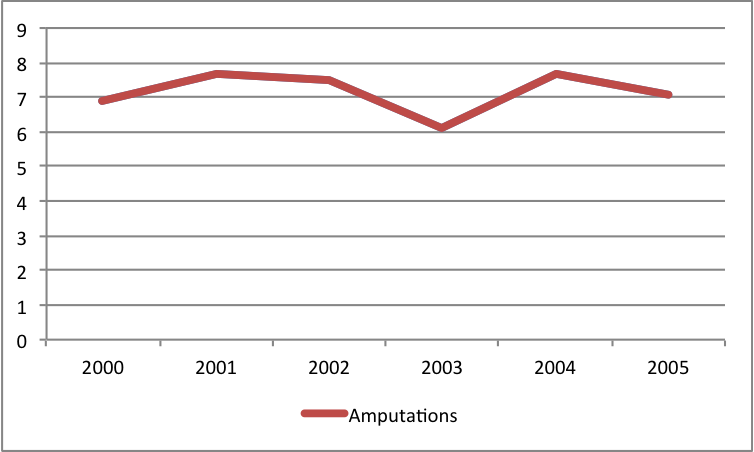
Say you wanted to chart the number of amputations per 100,000 workers over the past six years. The state of California has you covered.
That was pretty random, yes? Want Pneumoconiosis hospitalizations? Just check it out if you ever need health data, death data, politics – anyway, good resource.
Interesting stuff parts: 2, 3 & 4 which I hope to write about this week
Another random idea that I have certainly had before but never implemented … eek, I have to go check out but remind me it has to do with getting around the SAS Studio limit on ginormous data.
Also, F-test , p-value and r-square
And permutations, random data, bootstrapping and creating your own version of F-tests, t-values and p-values