Day 2: Start-up News – Boring, Important Measurement
It never ceases to amaze me that intelligent people will spend huge amounts of time doing a literature review, designing elaborate theories, generating elegant hypotheses, selecting a three-stage stratified random sample, performing multivariate analyses, and their measures on which this brilliant study rests are some questions they made up with their three best friends over Chardonnay during happy hour one Friday night. This is also known as the “panel of experts” method and it has the added benefit that it allows you to deduct the wine on your taxes. (Not actual tax advice. Consult your accountant. Of course, if you are doing your 1040 based on reading this blog, you are probably beyond help.)
We did not go with this approach. Our original idea was to use released items from the state standards test from North Dakota but, unfortunately, that is one of the states that never releases items. What we did was find standards that were the same, verbatim, as other states and then found items from those states that had been released. For example,
” Compute a given percent of a whole number”
and the problem would be
“What is 40% of 250?”
with the same four multiple choice options that had been used on the state test.
As someone pointed out, even if the same test had not been previously, since we pulled only the items that tested exactly what we included in the game, the individual items had been validated. So, we had content validity.
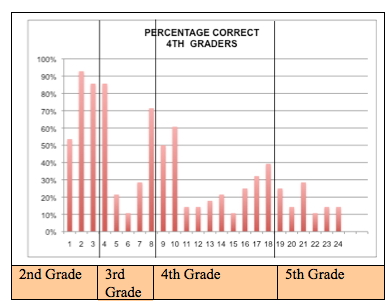
One bit of evidence for construct validity came from the item difficulty levels. Here is one of several charts. This shows what percentage of the fourth-grade students answered each item correctly. The items are broken down by grade level. It is also important to know that the state tests showed the majority of students at this school to be low-performing in mathematics. What we see is that as students go from second-grade level items, all of which the majority of the students answered correctly, to fifth-grade items, the percentage correct declines. We see that for the fifth-grade items, only one of them did the students exceed the 25% that would be answered correct by random guessing (remember, there were four multiple-choice options).
Since the state’s test have shown these students to be performing poorly, we should see that they generally are not at grade level, that is, they do not answer many of the fourth-grade items correctly at a rate exceeding chance. That, as you can see from the chart, is the exact situation.
Of course, we did more than this, beginning with replicating this identical chart with fifth-graders, who showed pretty much the same pattern but, as would be expected, answered a higher proportion correctly at each grade level than did the fourth-graders.
That’s the sort of thing that too many studies take for granted and never test. This isn’t the exciting part of creating a game, the part where you make an attack scene and the kid gets to shoot flaming arrows. So, what good does this do us? Well, the combination of the different analyses of the measure confirms that the measure we used for students to test whether or not their mathematics achievement increased is, in fact, a valid measure of mathematics achievement.
Also, this method has the advantage of not being required to share any of the wine with our best friend/ expert panel so we get to drink it all ourselves.
You can read more about our games at the 7 Generation Games site here.
One Comment