Don’t believe your numbers too much: IPEDS example
The famous statistician, F.N. (for Florence Nightingale) David was a professor at UC Riverside, where I earned my doctorate. My advisor told this story about her:
We were on this dissertation committee – I forget if it was for biology or what, back then, this was a small campus so if you were in statistics you could end up on any committee. So, he gets to the end of his defense, and F.N. David pulls the cigar out of her mouth and says,
“Young man, you believe your numbers far too much.”
The point Dr. Eyman was trying to make to me was that even if you have done every single computation perfectly …
“The government are very keen on amassing statistics. They collect them, add them, raise them to the nth power, take the cube root and prepare wonderful diagrams. But you must never forget that every one of these figures comes in the first instance from the village watchman, who just puts down what he damn pleases.”
– Josiah Stamp
What is a conscientious statistical consultant to do?
Start with getting to know your data better than God knows the Bible. Let’s start with analyzing secondary data, for example, IPEDS, that has already been collected. I’ll talk about collecting your own data later. Let me just put in a plug for doing it electronically if possible. Also, make sure your data entry staff know which is the intervention and which is the control group. (You think I’m kidding but I’m not.)
Secondary data analysis: Read the documentation!
You think that is obvious, do you? IPEDS is the Integrated Postsecondary Education Data System, collected by the National Center for Education Statistics. It is my favorite type of data set and the type you almost never get. It includes pretty much the entire population of interest.
If you don’t know these things, you don’t know your data:
- Is it a sample or the entire population?
- If it’s a sample, what proportion of the population was sampled and how? Randomly? Stratified random?
- Does the data set have sampling weights? What is the variable name for those weights (You’re going to use them, aren’t you? Please say yes.)
- How were the data recorded?
This isn’t all you need to know. We’ll talk about specific variables next.
One reason I like IPEDS is that you can be pretty sure everyone reported data because it’s mandatory for any institution who gets federal financial aid. It also includes the U.S. service academies, which are about the only post-secondary institutions who don’t. It also gives you a SAS program for reading the data after you upload it. There are also SPSS and STATA programs.
Another thing I liked about IPEDS is it is, inside and out, one of the best documented data sets I’ve seen. I’d recommend it as an example of how to do things if you are going to be creating data sets for secondary analysis yourself. Don’t get used to it, though, because most of what you’ll find in your career is far worse than this. Here is just a simple example from one data set.
*** Created:    October 2, 2018                                ***;
 *** Modify the path below to point to your data file.        ***;
 ***                                                          ***;
 *** The specified subdirectory was not created on            ***;
 *** your computer. You will need to do this.                 ***;
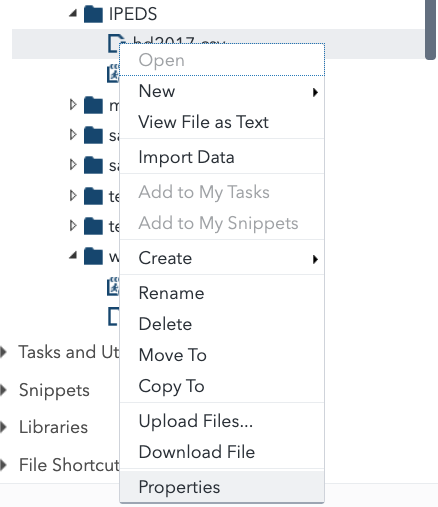
If you want to analyze it using SAS Studio, now you know that once you’ve uploaded the data, you do need to change the INFILE statement. If you don’t know the full path, ctrl-click (Mac) or right-click (Windows) on the data file and select PROPERTIES
Change the INFILE statement to what you see in the path, so now it looks like this
infile '/home/your_directory/IPEDS/hd2017.csv' delimiter=',' DSD MISSOVER firstobs=2 lrecl=32736;
You won’t necessarily have the delimiter, etc. It depends on your file. Okay, run it, you have data. Awesome!
When I run frequencies for the IPEDS data, I get 7,153 institutions but the IPEDS methodology report says there are 6,642. What the hell? Looking through the data, I find that 287 institutions were closed in either 2017 or prior. Another 38 were combined with another institution or not to be include for some unspecified reason “out of scope”. There were 41 that were “not primarily post-secondary institutions”, so I dropped those also. Since I’m only interested in individual, active institutions for the research I’m doing, I’m dropping those.
There were 88 institutions that were new in 2017 or had their Title IV (financial aid) eligibility restored. After debating back and forth, I decided to drop those, too. My interest is in developing a baseline of enrollment and retention, which these new institutions will only have for one year.
My point is that I’ve gotten one of the best data sets you could ever find and 7% of the data is inappropriate for my purpose. Does it matter as long as 93% of the data are correct? Well, I definitely think that my results would be less accurate.
My second point is that there is not anything “wrong” with the IPEDS data. I can imagine plenty of circumstances in which one would want to have the data on closed institutions.
These may seem like details, but I am pretty convinced that if you are not a “detail person” you are never going to make it in the long run as a statistical consultants. These details add up fast.
One last thought – if 7% of the data needed to be tossed out before we even got started, and this is an extremely well-funded, well-designed data set, what do you think the average secondary analysis is going to be like?