Exploring Your Data with SAS Enterprise Guide: Important Basics
I’m doing a Hands-On Workshop in Las Vegas at the Western Users of SAS Software conference in November. When they asked me for some topics, I thought about factor analysis or categorical data analysis, but I’m already doing a couple of other talks on those procedures.
I really felt like one of the most overlooked parts of data analysis was exploring your data and getting cozy with it.

So, I’m talking about exploratory data analysis, with a focus on the basics. There is a lot of talk about BIG data, but many of us spend our days with not-very-big-at-all data where a few errant records here and there can throw off your results.
Also, I don’t think SAS Enterprise Guide was really designed for ginormous data sets.
My workshop uses data from the pilot study for 7 Generation Games. Before you can go out and collect enormous amounts of data, you need to pilot your measures, your methods – and at this stage it really is important to understand your data.
One quick tip —
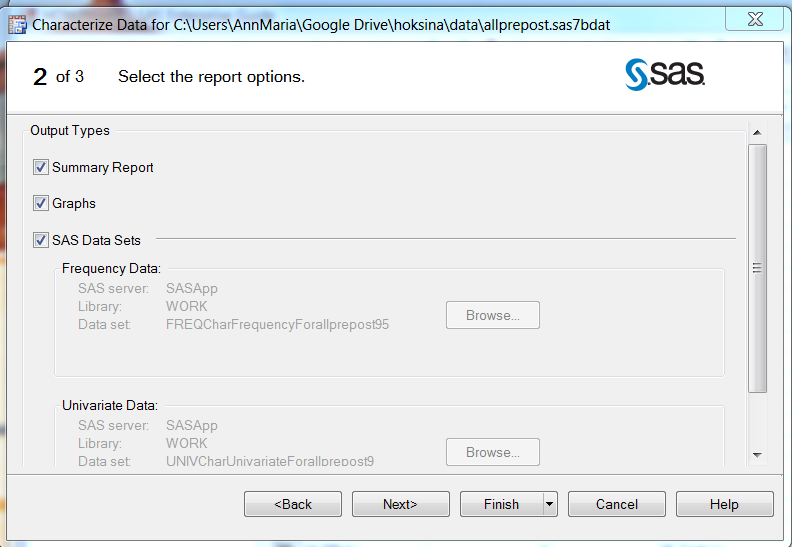
If you do the Characterize Data task (which you always should), it produces a data set of frequency distributions and another of univariate statistics. Notice in the second of the three pop-up windows, that’s the default. People often ignore those data sets created, which is too bad,
You can use the univariate statistics data set to create tables like the one below, selecting which descriptive statistics and variables you want.
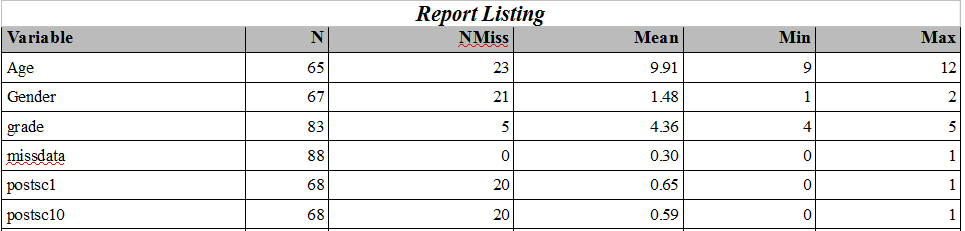
Of much more use than simple reports like this, you can sort your univariate statistics data set to get things like items in order of difficulty. As always, I have way more material than I can fit in the time allotted, but one part I will definitely keep in is the usefulness of these data sets for getting a second quick look at your data. (The first is the Characterize Data task. Didn’t you just read that I said you should always do it? Sheesh!)
If you’re interested, you can come to the presentation, “Telling stories with your data – graphs, tables and basic, basic statistics with SAS Enterprise Guide” in Las Vegas in November. Or you can check back on this blog as I ramble on about it while writing my paper.
Please send me a copy of your presentation and supporting documents
Thank you for your kind assistance
Regards