Is it sick to get this excited about data analysis?
The results are in! The chart below gladdens my little heart, somewhat.
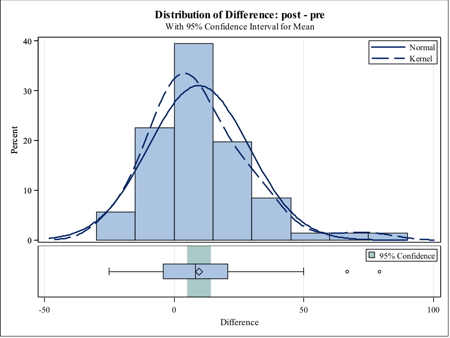
One thing to note is the fact that the 95% confidence interval is comfortably above zero. Another point is that it looks like a pretty normal distribution.
What is it? It is the difference between pretest and post-test scores for 71 students at two small, rural schools who played Spirit Lake: The Game.
I selected these schools to analyze first, and held my breath. These were the schools we had worked with the most closely, who had implemented the games as we had recommended (play twice a week for 25-30 minutes). If it didn’t work here, it probably wasn’t going to work.
Two years ago, with a sample of 39 students from 4th and 5th grade from one school, we found a significant difference compared to the control group.
COULD WE DO IT AGAIN?
You probably don’t feel nervous reading that statement because you have not spent the last three years of your life developing games that you hope will improve children’s performance in math.
The answer, at least for the first group of data we have analyzed is – YES!
Scores improved 20% from pre-test to post-test. This was not as impressive as the improvement of 30% we had found in the first year, but this group also began with a substantially higher score. Two years ago, the average student scored 39% on the pre-test. This year, for 71 students with complete data, the average pre-test score was 47.9% , the post-test mean was 57.4%. I started this post saying my little heart was gladdened “somewhat” because I still want to see the students improve more.
There is a lot more analysis to do. For a start, there is analysis of data from schools who were not part of our study but who used the pretest and post-test – with them, we can’t really tell how the game was implemented but at least we can get psychometric data on the tests.
We have data on persistence – which we might be able to correlate with post-test data, but I doubt it, since I suspect students who didn’t finish the game probably didn’t take the post-test.
We have data on Fish Lake, which also looks promising.
Overall, it’s just a great day to be a statistician at 7 Generation Games.

No, it’s very exciting!
Can I ask how their progress compared to progress without the game? Was this over a short span where their classes wouldn’t have made a significant difference (given the pre- condition), or a longer span where arguably the teacher was teaching them stuff?
I guess the ideal controls would be to have one group read a math book for the same amount of time (i.e. the hypothesis that it is merely spending time in mathland) and another that plays a different computer game, and perhaps another that does nothing at all.
Having said all that, 20% is pretty huge…
We had conducted a similar study two years ago and at that time the control group improved 10% (I mean, they ARE in school, you’d expect some improvement!) and the intervention group that played our games improved 30%. When we came back to do it again the superintendent of schools said no one was going to be in the control group because he wanted every student to improve. So, we were not able to have a control group. It is over 8 weeks when they play the game twice per week, so about 8 hours of total time on task.