Statistics save the world

I will be the first to admit that I’m not the warm fuzzy type. Maybe you’re like me, you’d like to do good for your community but you just can’t see yourself as a physician.
Maybe your bedside manner is to snap at someone to quit being a whiner.
Or maybe you really are a sweet kind person but you are not very extroverted. You just can’t see yourself looking someone in the eye and asking them to tell you about their problems at home. Perhaps you really genuinely care about children in your community and really would like to help them succeed in school but the thought of speaking in front of the 30 people makes you break out into a cold sweat – even if the 30 people are all under 13 years old.
Maybe, like me, you really like math. To be specific, maybe you really like analyzing data, looking for correlations, inspecting distributions. Maybe, you really like programming. Or that’s what we called it in my day – now all the cool kids call it coding.
Does that mean that we are condemned to be a bunch of Silicon Valley dwelling, Soylent swigging, soulless drones with nothing to keep us warm at night but our stock options? In fact, quite the opposite! These last few years I have been having a lot of fun working with statistics in two very different ways.
First of all, I’ve been working with our team at 7 Generation Games to make adventure games that teach statistical concepts.
Let me give you an example. Some items are more valuable than others. Why? Try to figure it out by looking at this distribution.
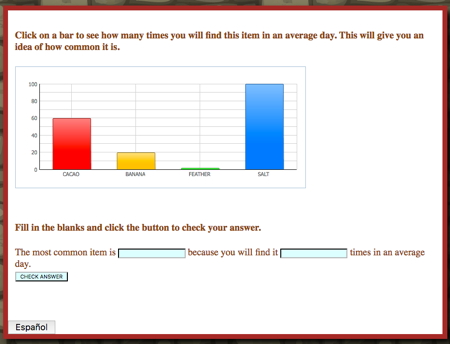
Players can click on this interactive graph for help reading it. They have a sentence written with blanks to fill in to model academic language.
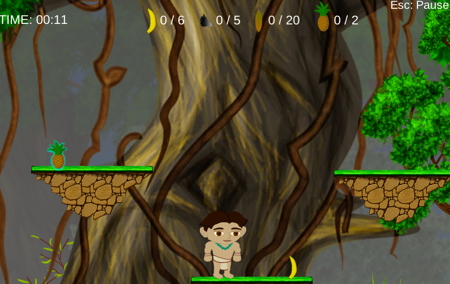
Once a student answers one or two questions in the game correctly, the reward is being able to play a related game – in this case, collecting items in the jungle. As you might guess, the more common items are worth less in the game.
Here is a second example. Below, we have a section of our 3D game where the player is building a pyramid.

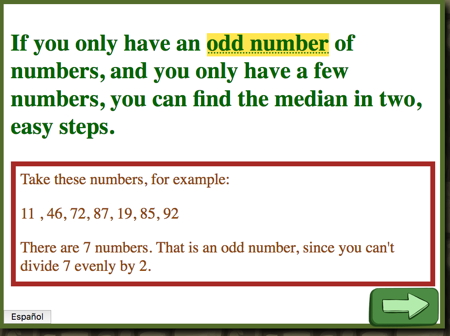
To build your pyramid fast enough that the Emperor doesn’t decide to chop off your head, you want to get stronger than average workers. What is an easy way to determine if you have stronger than average workers? Find the median!
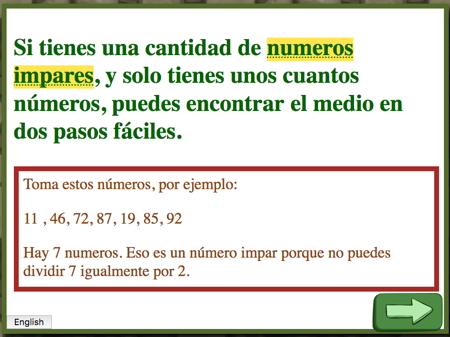
Players can also click a button to switch the page to an explanation in Spanish.
Just because we were all out last night at the Latino Tech meet-up to celebrate Hispanic Heritage Month, don’t assume everything we make it is focused on Latinos.

Here is yet another example of teaching statistics in a game, this one re-tracing the Ojibwe migration.
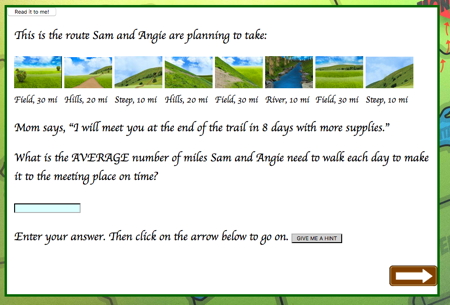
In this case, the player computes an average to figure how many miles need to be walked per day to get to the end of the trail in eight days.
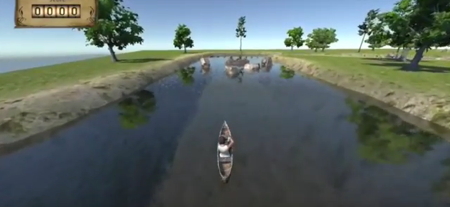
Get this question right and you can play the next level, where you canoe down the river to meet up with your old uncle who will – surprise – pose another statistics problem before you can move on to the next level.
So, there you have it! You can apply your knowledge of statistics to create adventure video games that teach students. As you can see, you also can apply knowledge of programming to meet the special needs of students whether it is to have a page read to them (did you notice the read it to me button in the page above?) Or to have it translated into a second language.
I’ll bet that you thought I was going to talk about using statistics to evaluate whether the games worked. That, is a post for another day.
_______

One Comment