Make a note of this overlooked feature in SAS Enterprise Guide
Sometimes the simplest things can make life easier. When I start exploring a new data set, the first thing I do is the Characterize Data task. With even modest-sized datasets this produces a lot of output. For example, the data from Spirit Lake: The Game, with about 80 variables and 88 subjects produced 93 pages. Clearly, I’m going to mostly scan through this looking for outliers, problems or anything interesting that strikes me before moving on to more focused analysis.
What would strike me as interesting?
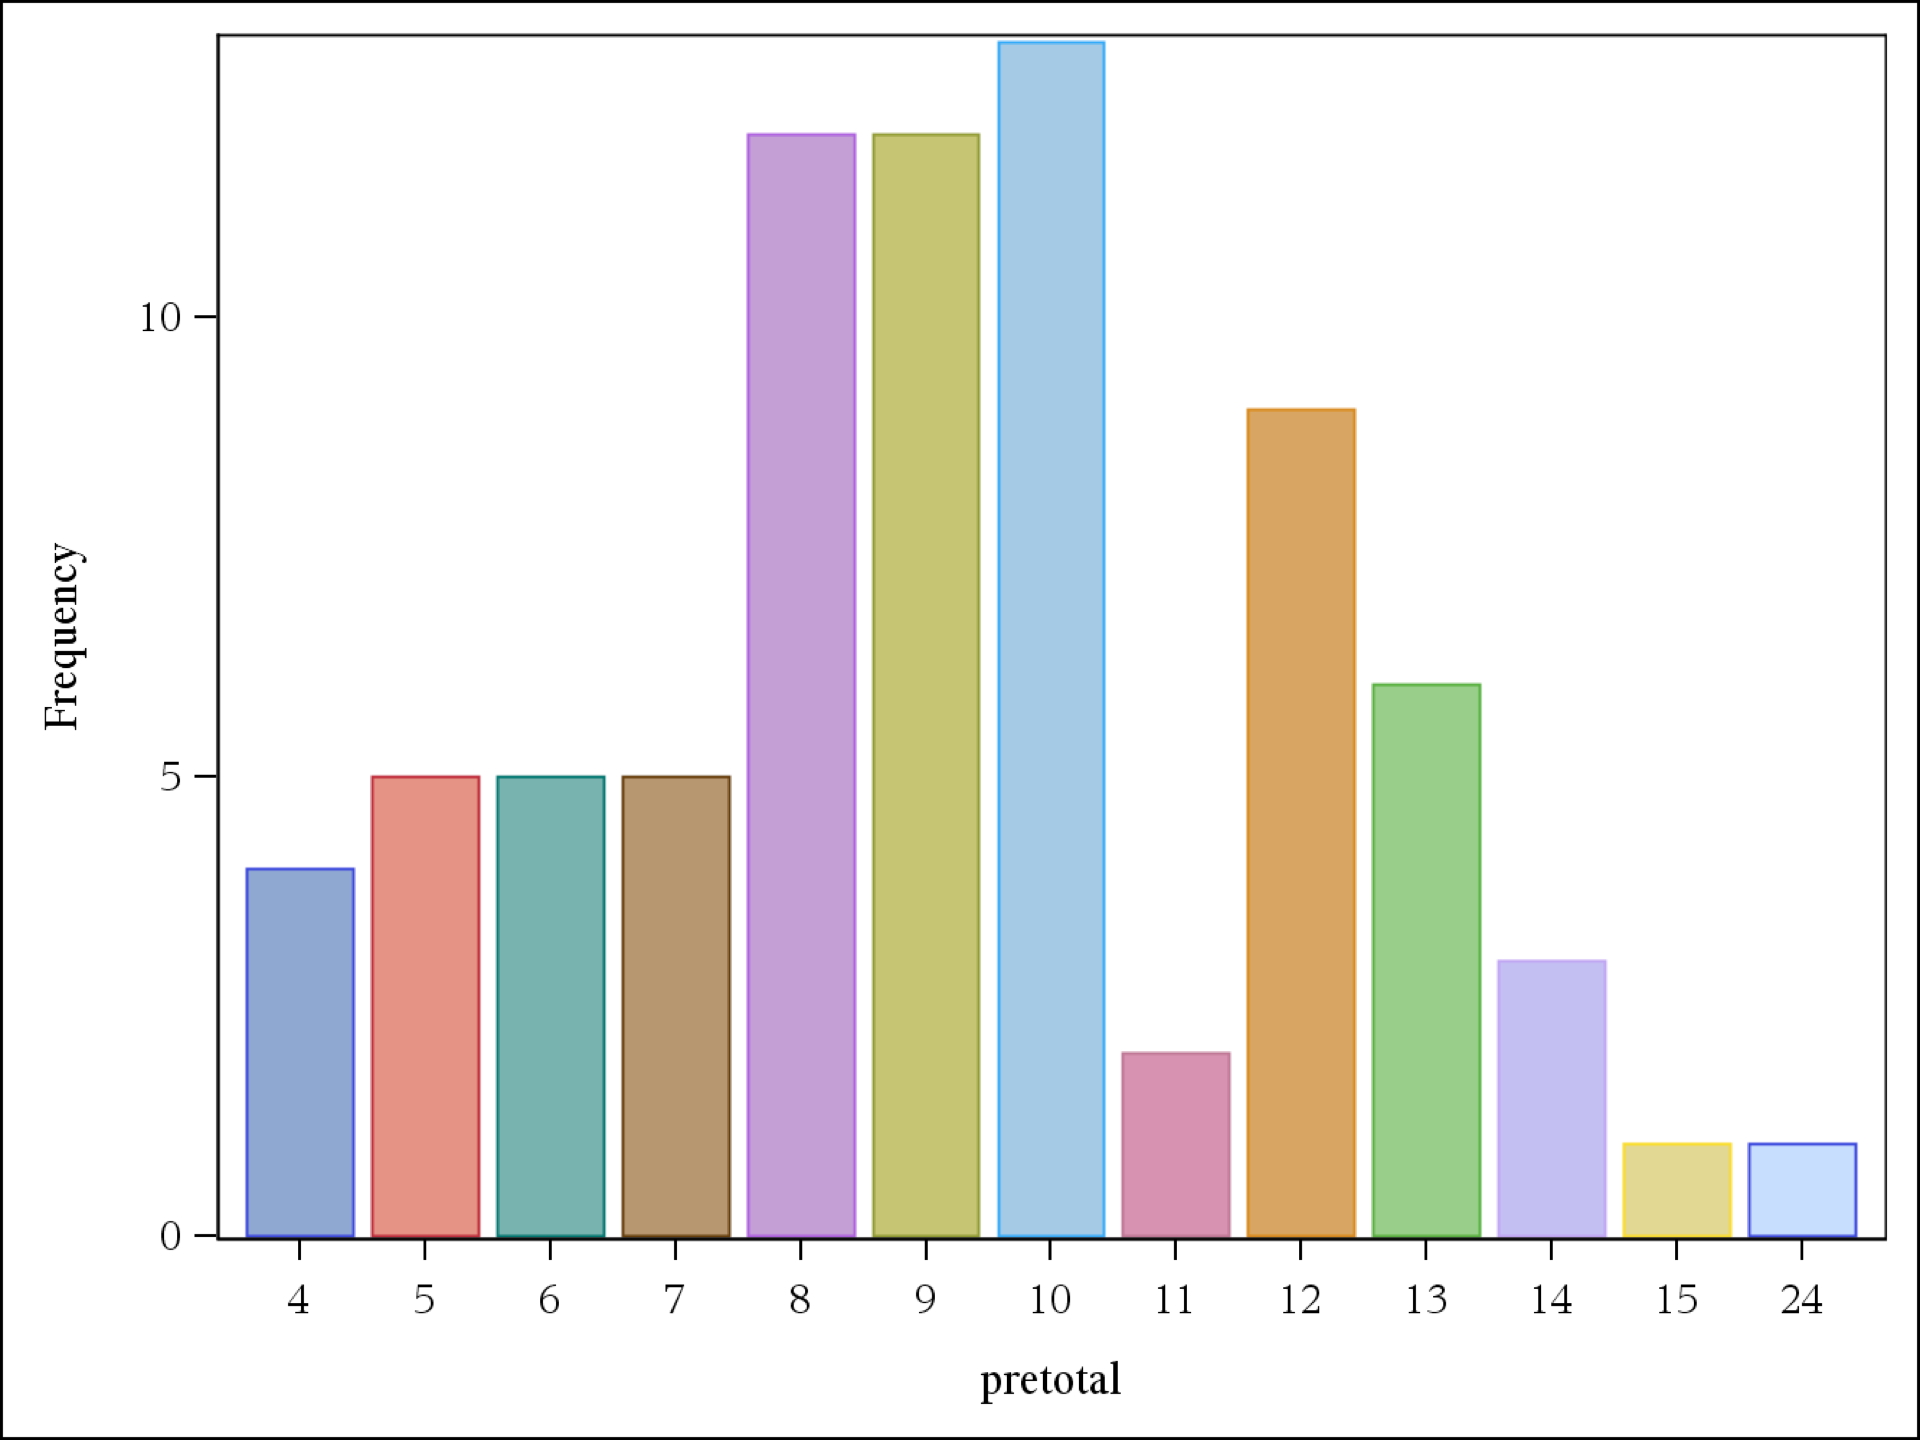 This, for instance, shows the pretest scores for the whole group. You can se that the mode is 10 and the distribution is somewhat heavier to the right of that mean. This is interesting because the first 18 questions on the test are fourth-grade math or lower and more than a third of the students are in the fifth-grade. I’d have expected higher scores. At this point, I want to make a note to myself to take a look at the frequency distributions of grade by pre-test score and also the percentage correct by grade.
Moving on, I see that the post-test score graph seems to have shifted a bit to the right, as one would hope, if the game is successful in raising students’ math scores.
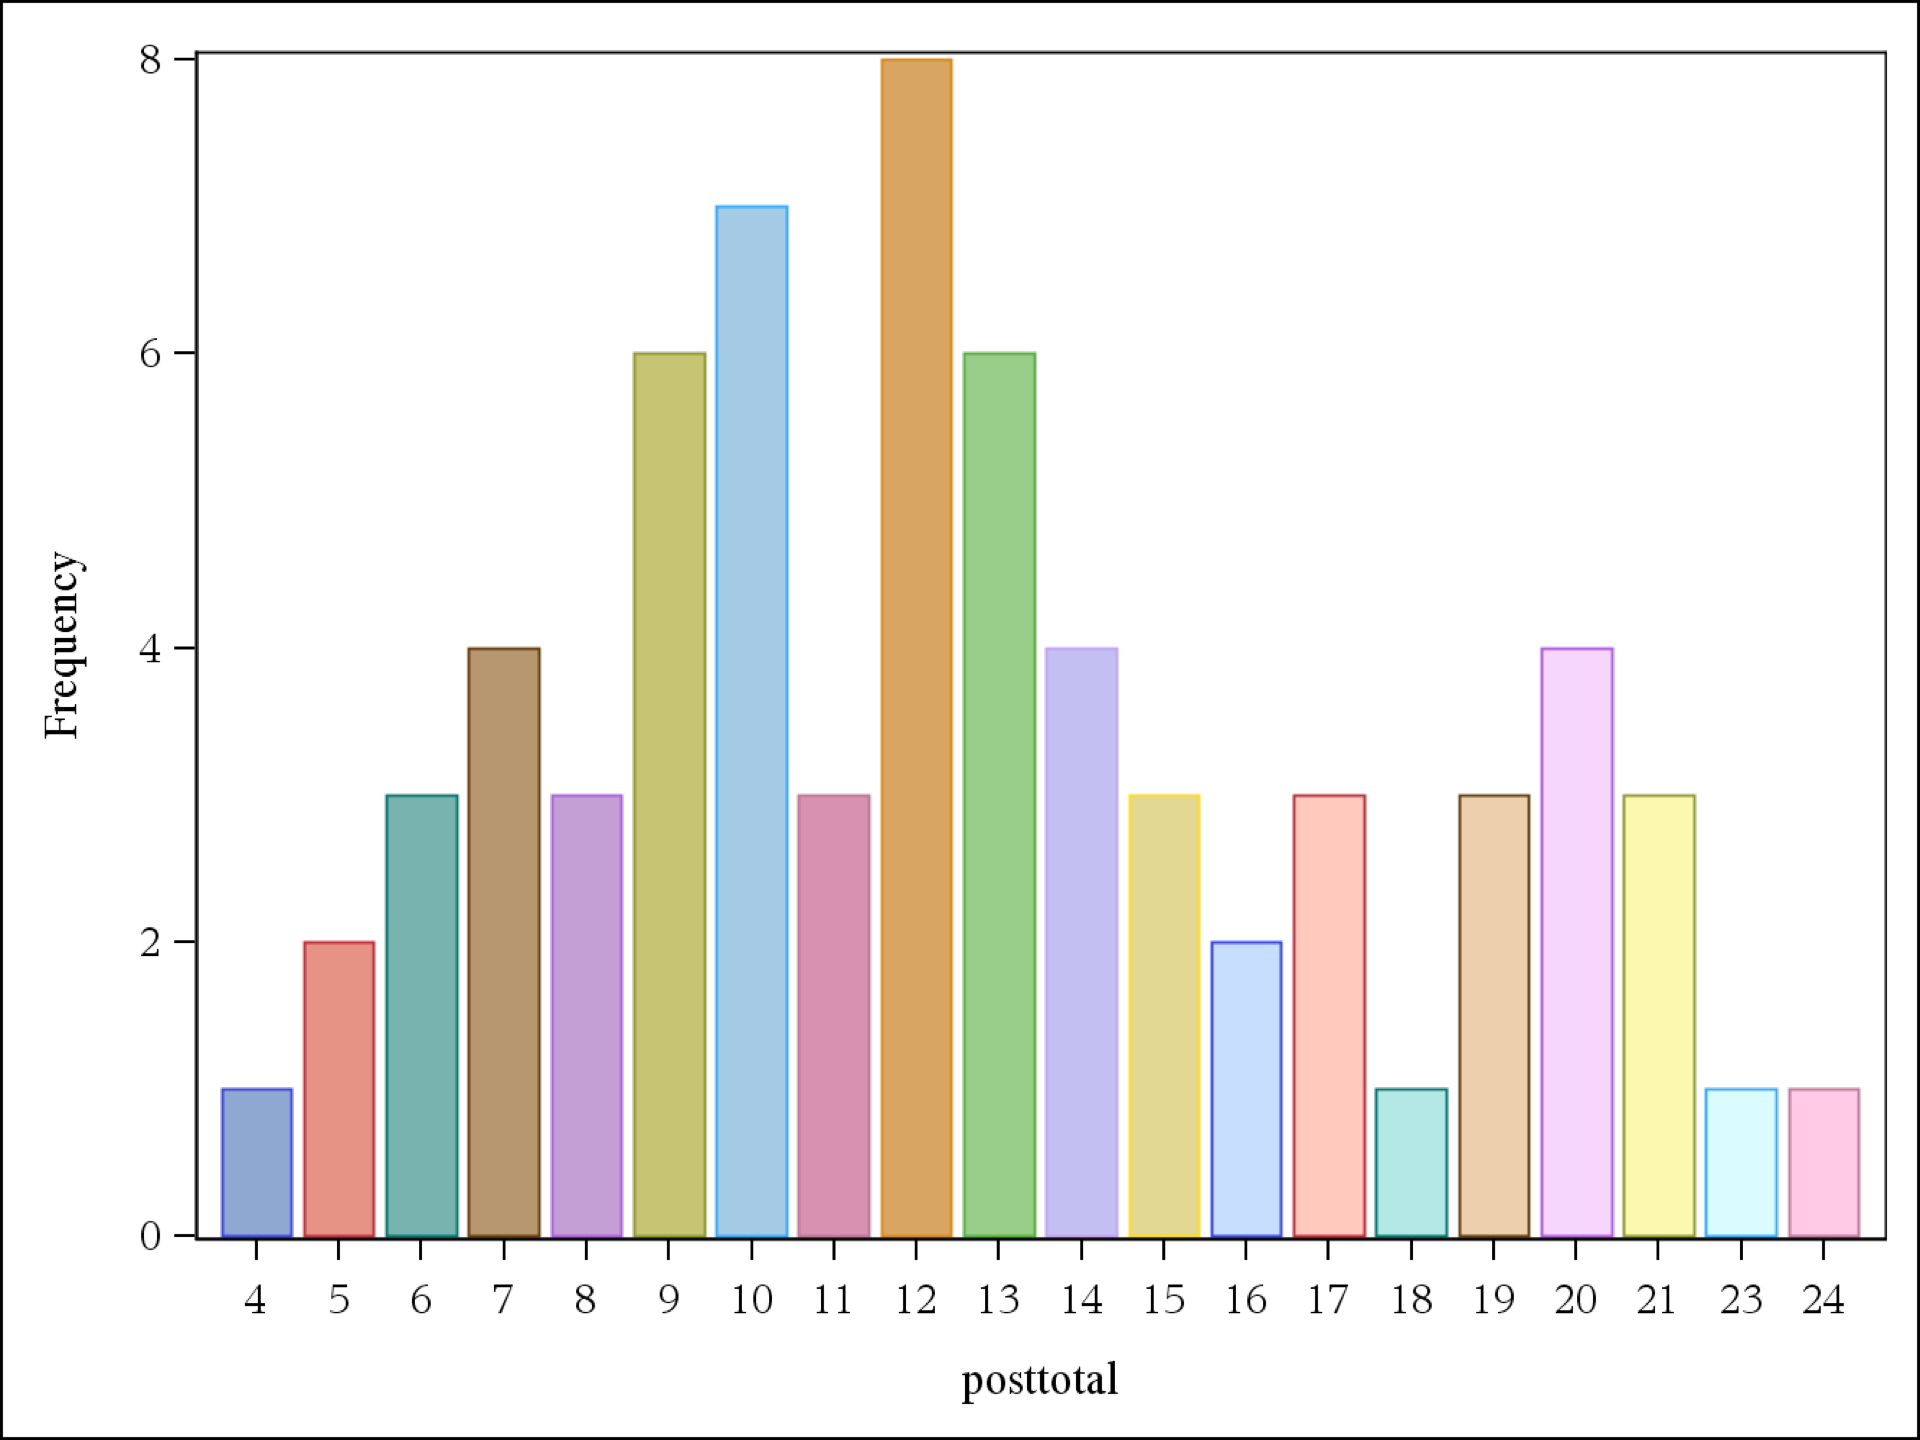 You can see that the mode is now 12. However, if you look closely, you can also see that t he Y axis is not the same on both graphs. It would be nice to take a look at these with the same axis. It would also be nice to take a look at these graphs separately by group, experimental and control. Of course, I want to do a dependent t-test, also a repeated measures ANOVA, with grade and group as the independent variables.
Now, I will certainly remember the repeated measures ANOVA and the t-test, but what about that other stuff? Not crucial, but, like I said, interesting, and might be nice in a presentation for a non-technical audience.
So … right in your SAS Enterprise Guide project there is an often over-looked option … go to FILE > NEW > NOTE
 and it will bring up a sticky note where you can write whatever it is you want to remember. Just close the note and it stays in your project as a small icon. Now, when you come back to it – because you really are busy and got distracted by 47 other things you had to do – you can pick up right where you left off. As you are reviewing your project wondering if there is any analysis you wanted to do that you forgot, you can take two minutes to click through your notes.
I knew this feature was there for years and never used it, and now, because we have so many different tasks happening at once with our new start-up and I’m continuously being interrupted, it is a godsend.
One Comment