How do I write a statistical analysis paper: Step two
In the last post, I posed the following null hypothesis as an example:
There is no difference in obesity among Caucasians, African-Americans and Latinos.
You can see the results from the statistical analyses here.
Since my question only pertains to those three groups, let’s begin by creating a data set with just those subjects.
libname mydata “/courses/ab1234/c_0001/” access=readonly;
Data example ;
set mydata.coh602;
where race ne “” ;
Don’t forget to run the program!
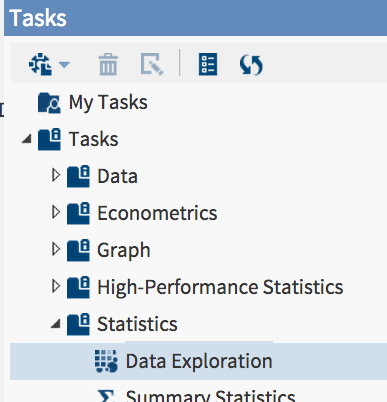
Now, let’s do something new and use something relatively new, the tasks in SAS Studio. On the left screen, click on TASKS, then on STATISTICS, then click DATA EXPLORATION.
Once you click on DATA EXPLORATION, in the right window pane you’ll see several boxes, but the first thing you need to do is select the correct data set. To do that, click on the thing that looks like a sort of spreadsheet.
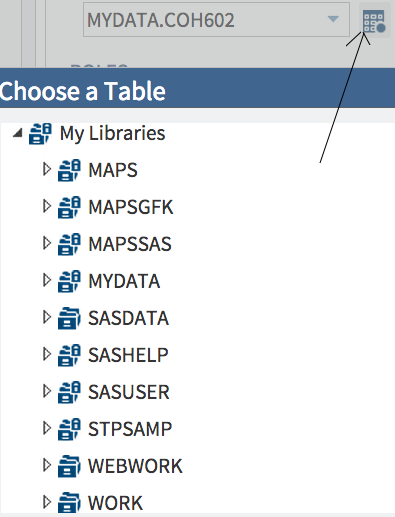 When you do that, you’ll see the list of libraries available to you. You need to scroll all the way down to the WORK library. This is where temporary data sets that you create are stored. Click on the WORK library to see the list of data sets in it.
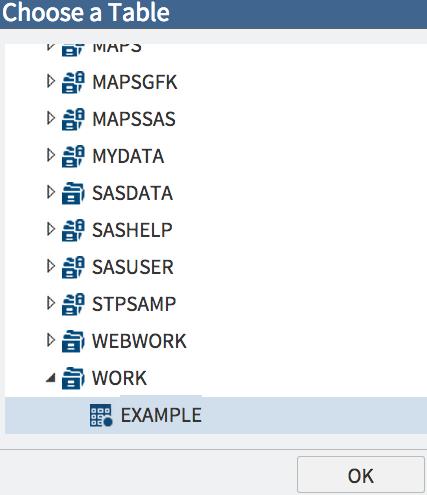 Select the EXAMPLE data set and click on OK. Now that you have your data set, it is time to select your variables.
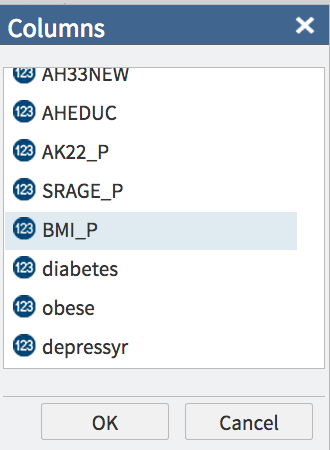
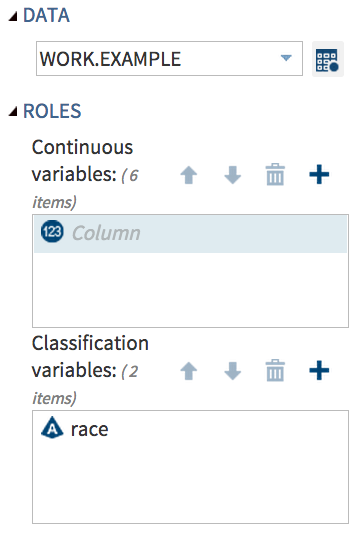 Click on the + next to the variables and you’ll get a list of variables from which you can select. Scroll down and select the variable you want. First, as shown above, I selected RACE for the classification variable.
This gives me a chart, and it appears that whites have a lower body mass index than black or Latino respondents in this survey.
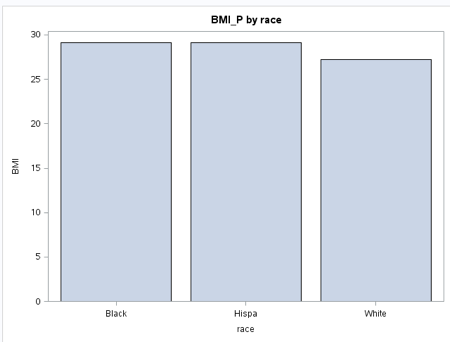 My next analysis is to do the summary statistics. I simply click on SUMMARY STATISTICS under the statistics tab (it’s right under data exploration) and select the same two variables. You can click here to see the results. Mean BMI for both the black and Hispanic samples was 29, while for whites it was 27. Standard deviations for the three groups ranged from 5.7 to 6.9 which was actually less than I expected.
So, there are differences in body mass index by race/ ethnicity, but that leaves a few questions left:
- Do those differences persist when you control for age and gender?
- While there are differences in body mass index, that doesn’t necessarily mean more people are obese. Maybe there are more underweight white people. Hey, it’s possible.
Well, now you have a chart and a table to add to the table you created in the first analyses. In the next post, we can move on to those other questions.
Hi AnnMaria,
Good step by step article on using SAS Studio!
I noticed the link to your summary statistics output was relative URL and you’ve added the domain to it again. Was able to find it the results by going to the page http://www.thejuliagroup.com/documents/tasks/summary.html but thought you may want to fix up the hyperlink in the article.
Thanks,
Michelle