Mama, what’s a scree plot?
You wouldn’t think there would be that much to say about scree plots. That is because you are like me and sometimes wrong.
The problem I often have teaching is that I assume people know a lot more than is reasonable to expect for someone coming into a course. Sometimes, I’m like a toddler who thinks that because she knows what color hat the baby was wearing yesterday that you do, too.

So …. a scree plot is a plot of the eigenvalues by the factor number. In the chart below, the first factor has an eigenvalue of about 5.5 while the eigenvalue of the second factor is around 1.5. (If you don’t know what an eigenvalue is, read this post. )
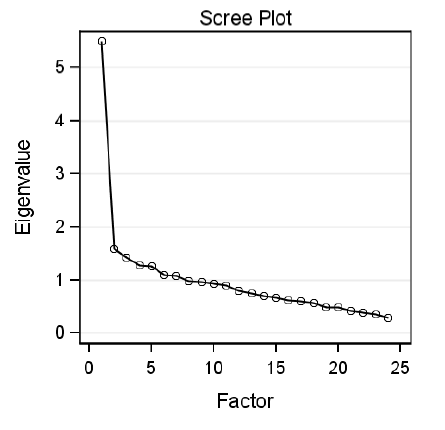
As I mentioned in the previous post, an eigenvalue greater than 1 explains more than a single item, but as you can tell by looking at the plot, some of those eigenvalues are barely higher than one. Should you keep them? Or not?
What is scree, anyway? Scree is a pile of debris at the base of a cliff. In a scree plot, the real factors are at the top of the cliff and the scree is the random factors at the bottom you should discard. So, based on this, you might decide you only have one real factor.
The idea is to discard all of the factors after the line starts to flatten out. But is that after 1 factor? It kind of flattens out after four? Maybe?
Sometimes a scree plot is really clear, but this one, not as much. So, what should you do next?
Hmm … maybe I should write another post on that.