SAS Studio: Finding prevalence with pointing and clicking
Policy makers have very good reason for wanting to know how common a condition or disease is. It allows them to plan and budget for treatment facilities, supplies of medication, rehabilitation personnel. There are two broad answers to the question, “How common is condition X?” and, interestingly, both of these use the exact same SAS procedures. Prevalence is the number of persons with a condition divided by the number in the population. It’s often given as per thousand, or per 100,000, depending on how common the condition is. Prevalence is often referred to as a snapshot. It’s how many people have a condition at any given time.
Just for fun, let’s take a look at how to compute prevalence with SAS Studio.
Step 1: Access your data set
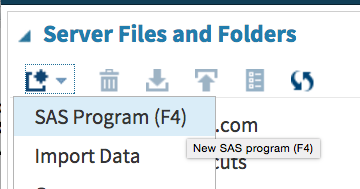
First, assign a libname so that you can access your data. To do that, you create a new SAS program by clicking on the first tab in the top menu and selecting SAS Program.
libname mydata "/courses/number/number/" access=readonly;
(Students only have readonly access to data sets in the course directory. This prevents them from accidentally deleting files shared by the whole class. As a professor with many years of experience, let me just tell you that this is a GREAT idea.)
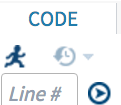
Click on the little running guy at the top of your screen and, voila, your LIBNAME is assigned and the directory is now available for access.
(Didn’t believe me there is a little running guy that means “run”? Ha!)
Next, in the left window pane, click on Tasks and in the window to the right, click on the icon next to the data field.
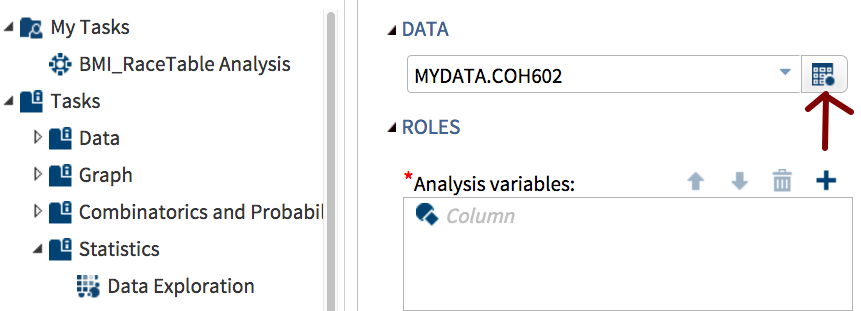
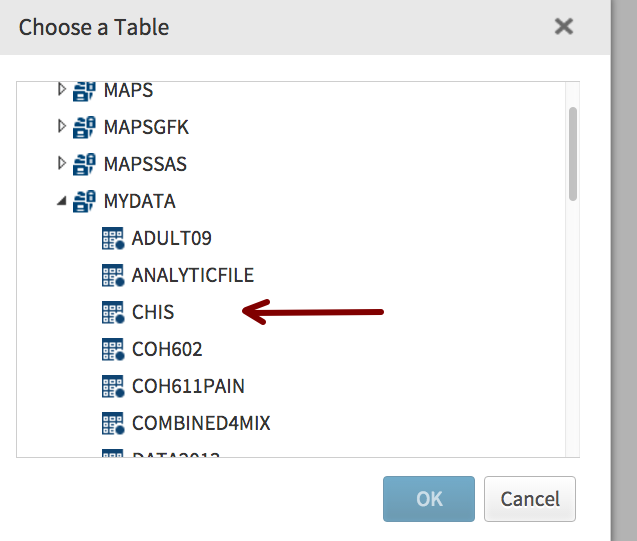
From the drop down menu of directories, select the one with your data and then click on the file you need to analyze.
Step 2: Select the statistic that you want and then select the variable. In this case, I selected one-way frequencies, and one cool thing is that SAS will automatically show you ONLY the roles you need for a specific test. If you were doing a two-sample t-test, for example, it would ask for you groups variable and your analysis variable. Since I am doing a one-way frequency, there is only an analysis variable.
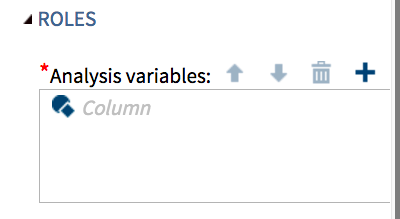
When you click on the plus next to Analysis Variables, all of the variables in your data set pop up and you can select which you want to use. Then, click on your little running guy again, and voila again, results.
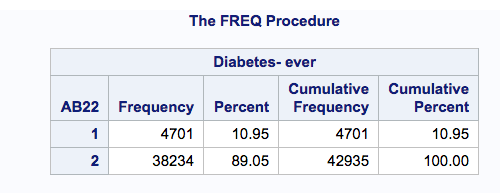
So … the prevalence of diabetes is about 11% of the ADULT population in California, or about 110 per 1,000.
You can also code it very simply if you would like:
libname mydata “/courses/number/number/” access=readonly;
PROC FREQ DATA = mydata.datasetname ;
TABLE variable ;
Of course, all of this assumes that your data is cleaned and you have a binary variable with has disease/ doesn’t have disease, which is a pretty large assumption.
Now, curiously, the code above is the exact SAME code we used to compute incidence of Down syndrome a few weeks ago. What’s up with that and how can you use the exact same code to compute two different statistics?
Patience, my dear. That is a post for another day.
Curious- how current are the data sets that you are able to access?
The data used here was the 2011 California Health Interview Survey.