The Village Watchman and SAS Enterprise Guide Summary Tables
The government is extremely fond of amassing great quantities of statistics. These are raised to the nth degree, the cube roots are extracted, and the results are arranged into elaborate and impressive displays. What must be kept ever in mind, however, is that in every case, the figures are first put down by a village watchman, and he puts down anything he damn well pleases.
Josiah Stamp
Any time you do anything with any data your first step is to consider the wisdom of Sir Josiah Stamp and check the validity of your data. One quick first step is using the Summary Tables task from SAS Enterprise Guide. If you are not familiar with SAS Enterprise Guide, it is a menu driven application for using SAS for data analysis. You can open a program window and write code if you like, and I do that every now and then but that’s another post. In my experience, SAS Enterprise Guide works much better with smaller data sets – defined by me, as the blog owner, of less than 400,000 records or so. Your mileage may vary depending upon your system.
How to do it:
- Open SAS Enterprise Guide
- Open your data set – (FILE > OPEN > DATA)
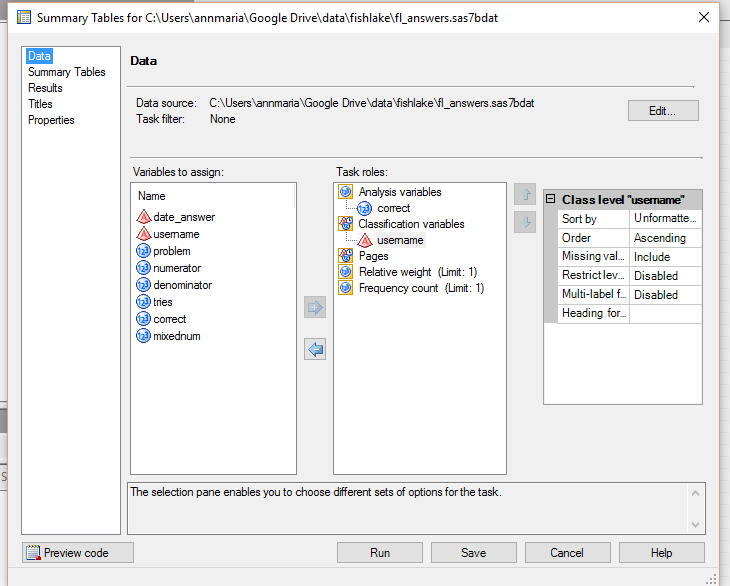
- From the TASKS menu, select DESCRIBE and then SUMMARY TABLES. The window below will pop up
- Drag the variables to the roles you want for each. Since I have less than 450 usernames here, I just quickly want to see are there duplicates, errors (e.g. ‘gret bear’ is really the same kid as ‘grey bear’ , with a typo). I also want to find out the number of problems each student attempted and the percent correct. So, I drag ‘username’ under CLASSIFICATION VARIABLES and ‘correct’ under ANALYSIS variables. You can have more than one of each but it just so happens I only have one classification and one analysis variable I’m interested in right now.
5. Next click on the tab at left that says SUMMARY TABLES and drag your variables and statistics where you want them. I want ‘username’ as the row, so I drag it to the side, ‘correct’ as the column, N is already filled in as a statistic if you drag your classification variable to the table first. I also want the mean, so I drag that next to the N. Then, click RUN.
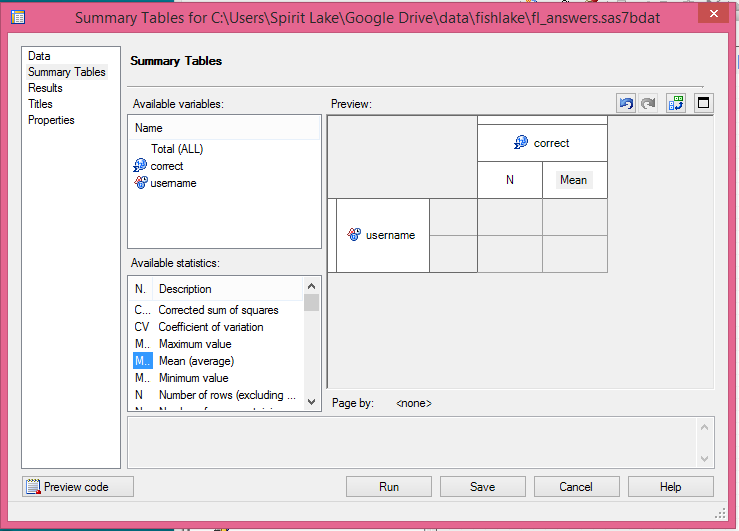
Wait a minute! Didn’t I say I wanted the percent correct for each student? Why would I select mean instead of percent?
Because the pctN will simply tell me what percent of the total N responses from this username make up. I don’t want that. Since the answers are score 0 = wrong, 1= right, the mean will tell me what percentage of the questions were answered correctly by each student. Hey, I know what I’m doing here.
6. Look at the data! In looking at the raw data, I see that there are two erroneous usernames that shouldn’t be there. These data have been cleaned pretty well already, so I don’t find much to fix.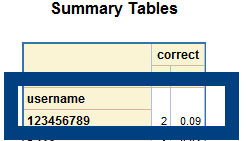 Now, I want to re-run the analysis deleting these two usernames.
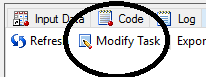
7. At the top of your table, you’ll see an option that says “Modify Task”. Click that.
 8. You’ll have the summary tables window pop up, this time with your data filled in. Click on the edit button at the top right of this window. You are about to create a task filter.
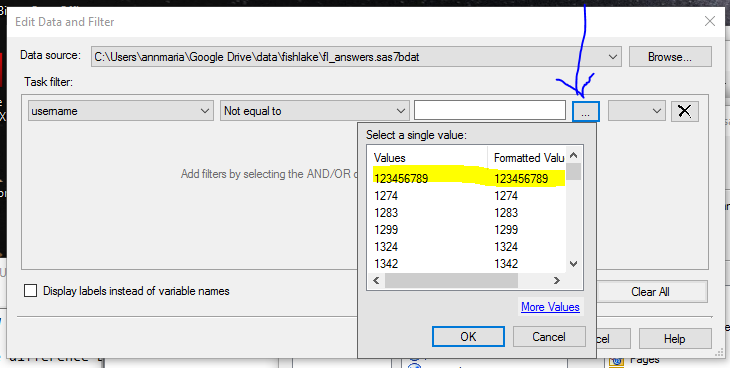
8. Under TASK FILTER pull down the first box to show the variable ‘username’. Pull down the second box to show the option NOT EQUAL TO and then click the three dots next to the third box. This will pull up a list of all of your values for usernames. You can select the one you want to exclude and click OK. Next to the three dots, pull down to select AND, then go through this to select the second username you want to delete. You can also just type in the values, but I tend to do it this way because I’m a bad typist with a bad short-term memory.
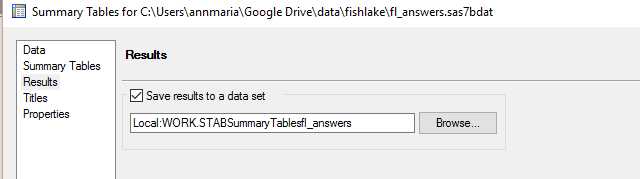
 9. Create a SAS dataset of the output. It’s super easy. Click on the RESULTS tab to the left and in the window that pops up click SAVE RESULTS TO A DATA SET. Then, click RUN.
 10. The most recently created data set should be your default data set for analysis but click on it in your process flow diagram to activate it just in case.
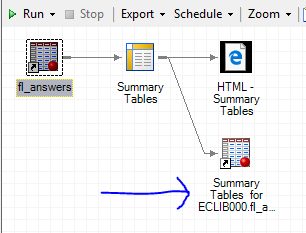
11. From the DESCRIBE menu again select SUMMARY STATISTICS
12. Drag ‘correct_mean’ under ANALYSIS VARIABLES and click RUN.
The resulting table gives me my answer – the mean is .838 with a standard deviation of .26 for N=424 subjects. So … the average subject answered 84% of the problems correctly. This, however, is just the first step. There are couple more interesting questions to be answered with this data set before moving on. Read the next step here.
————–
Want to play the game that produced these data? Own a Mac or Windows computer? Have ten bucks?

One Comment