How to compute a standard deviation and control chart when you don’t have raw data
- I created two data sets, named q4disc and q4disc3, keeping the month of discharge and the number dissatisfied at discharge and dissatisfied 3 months later, respectively.
- I read in the 3 values I was given, month of sample, number unsatisfied at discharge and number unsatisfied 3 months later.
- Now, I am going to create a data set of raw data based on the numbers I have. First, in a do loop, for as many as people said they were unsatisfied, I set the value of undisc (unsatisfied at discharge) to to 1 and output a record to the q4disc dataset.
- Next, in a do loop for 500- the number dissatisfied, I set undisc = 0 and output a record to the same dataset.
- Now, repeat steps 3 & 4 to create a data set of the values of people unhappy 3 months after discharge.
- Following the programming statements are the original data.
So, now, I have created two data sets of 6,000 records each with three variables. Doesn’t seem that efficient of a way to do it but now I have the data I need and it didn’t take long and doesn’t take up much space.
“The XSCHART statement creates  and
and  charts for subgroup means and standard deviations, which are used to analyze the central tendency and variability of a process.”
For the three months after discharge variable, just do another PROC SHEWHART with q4disc3 as the dataset and undisc3 as the measurement variable.
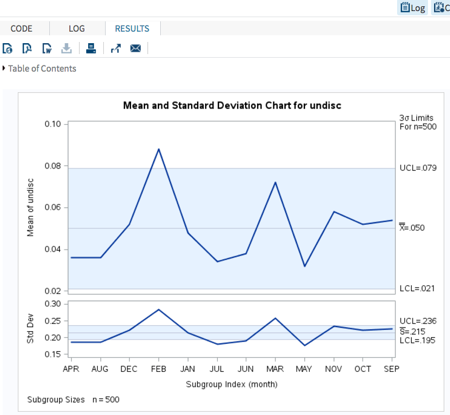
OR , once you have the dataset created, you can get the chart using SAS Studio by selecting the CONTROL CHARTS task
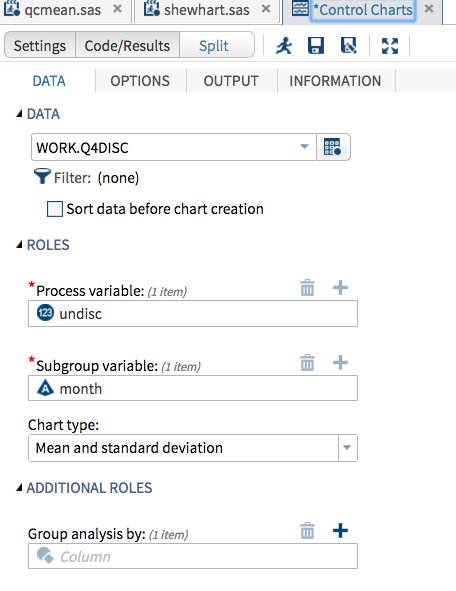
Either way will give you this result:

For random advice from me and my lovely children, subscribe to our youtube channel 7GenGames TV
Thanks dear for explaining the concept in brief.
You could also avoid rebuilding pseudo–raw data by using the binomial model directly. For control charts on proportions, a p-chart with subgroup size = 500 and count of unsatisfied as the numerator gives correct limits without expanding to thousands of rows. The standard deviation can be computed from (1−)/p(1−p)/n per month. That approach is more efficient and aligns better with attribute control chart methodology.