What would you do if one person changed your results?
This is a hypothetical question, but it could easily happen. Let me give you a real example.
Using a mobile phone game, we administered a standard depression screening measure (CESD-C) to 18 children living on or near an American Indian reservation. All children had a family member who was an alcoholic or addicted to drugs. I decide to do a one-sample t-test of the hypothesis that the mean for this population = 15, which is the cutoff value for symptoms of depression . Here is the code but I didn’t code it (more about that later).
PROC TTEST DATA=cesd_score SIDES=2 H0=15 plots(showh0);
var CESDTotal;
The results are shown below, with a mean of 21 and a range from 3 to 38.
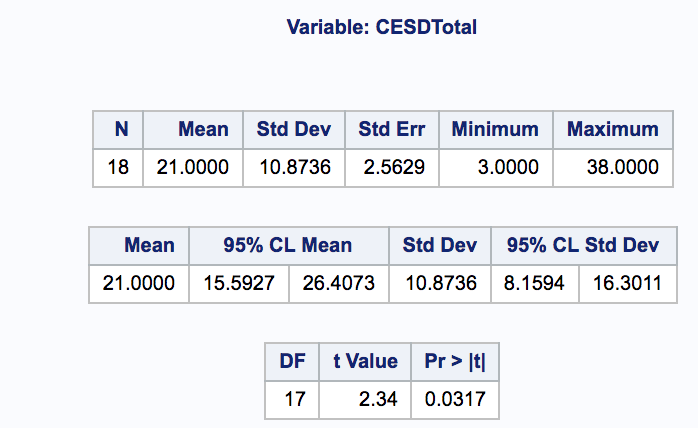
You can see that the t-value of 2.34 is significant at p < .05, that is the mean for this sample is significantly different than the cutoff score of 15. You can see more results here. What if it hadn’t been, though? What if, instead of .0317 the probability was .0517?
What if dropping out this one person with a score of 3 changed the result? In fact, it did change the mean to 22, and the p-value to .0115 . You can see all of those results here.
So, let’s say that hypothetically dropping out this outlier WOULD change your results. Would you do it? Would you report it?
Think about it. In a couple of days, I will give you my answer and my justification.
As to not having coded it – I used the tasks in SAS Studio which I found to be pretty fun, but more on that in my next post.
Play Aztech: Meet the Maya – for your iPad in the app store, in Spanish and English. The second in our series of bilingual games teaching basic statistics and Latin American history. Only $1.99

P.S. There is a third possibility here, which is changing the test from a two-tailed test to one-tailed test. Surely, an argument can be made that we don’t expect children with a family member who is addicted to alcohol or drugs to be less depressed than the cut-off score? They would either be equal or more depressed. Personally, I don’t buy that argument. I could accept that the sample might be more depressed than the average but I’m not sure one could justify that the mean necessarily MUST be more than the cut-off for depressive symptoms.