Probability and z-scores
For many students just learning statistics, the relationship of z-scores and probability is confusing.
Let’s try this concrete example. Here is a chart of the distribution of height in a sample of over 2,800 women.
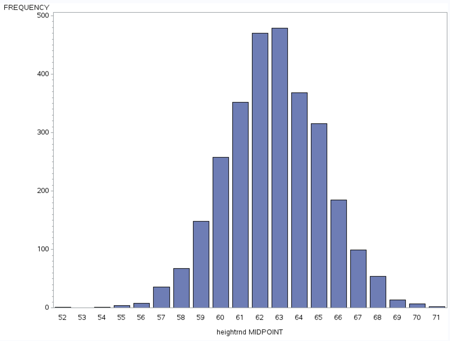
Notice that the peak, the mode is around 62-63 inches.
You can see the frequency table here, as well as a larger picture of the histogram. You’ll notice the median is between 62 and 63 inches
The mean is 62.7 – between 62 and 63 inches.
Looks like a normal distribution in that mean = median = mode.
Let’s go back to that mean of 62.7 inches. The standard deviation in this population is 2.46. What would 2 standard deviations above the mean be? Let’s round our 2 x 2.46 = 4.92 up to 5.
The mean + 2 standard deviations = 62.7 + 5 = 67.7
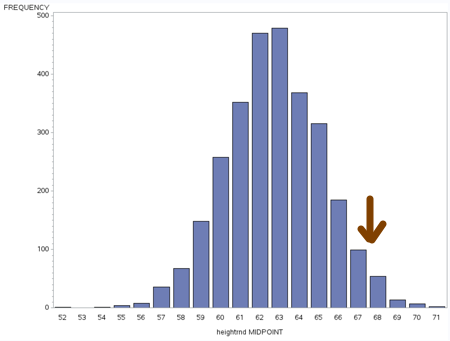
So, this is a perfect demonstration of what we mean when we say that 97.5% of the people fall below 2 standard deviations above the mean.