The Myth of Equivalent Groups

In fantasy land and fairy tales, there is this thing called equivalent groups. People are randomly assigned to a control group and a treatment group. Everyone in the treatment group receives the same treatment, for example, being sprinkled with exactly three teaspoons of fairy dust, and everyone in the control group does not. The two groups are equivalent except for this treatment and any difference between the groups is due to the three-teaspoon treatment – or so the story goes.
We have written a computer game to teach math. We are extremely fortunate that the community has exactly two schools, about 30 miles apart. The income and racial distribution is identical between the two schools – both are 99% Native American and 99% low-income. The pretest scores were equivalent. Perfect, yes?
One very cool thing about our game is, unlike a lot of web-based games, it tracks individual students by day, not just their answers but how much time they spent playing the game. Let me show you a picture of just one example.
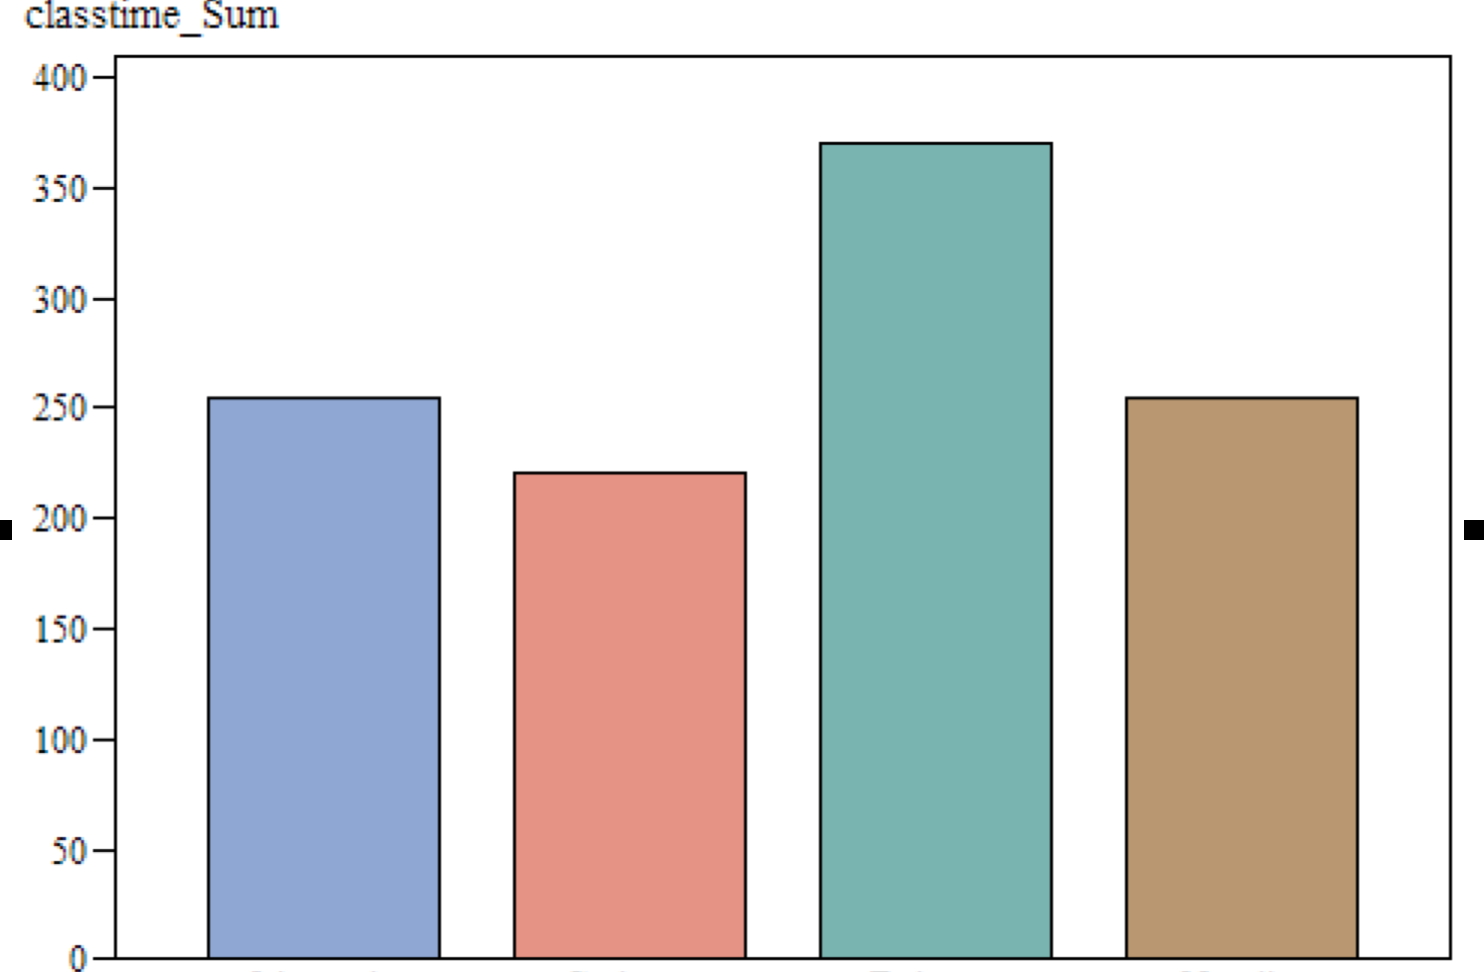
These bars represent the number of minutes played by each group, with the teachers’ names removed for confidentiality. In six weeks, one class has played the game a total of 370 minutes, another 220 minutes and the other two somewhere in between. Theoretically, each class was supposed to play for 90 minutes each week – these were equivalent groups. That did not turn out to be the case. They were all SCHEDULED for 90 minutes. However, what we are able to measure here is time on task – from when the student completed the first task in the game to the last task before the student logged out.
The group with the green bar started out with two 45-minute periods per week, while the two groups to the left started out with three, 30-minute periods a week. Not surprising, our green group ended up showing more time actually playing the game because the other two groups had 50% more time spent in set-up and logging off. With 16 or 18 little kids, it takes ten minutes for everyone to get a laptop, turn it on, plug in headphones, plug in the mouse, log in, start up the game, and then do it again at the end.
You might assume this would be true and compare the group that did two 45-minute periods with the ones that did three 30-minute periods. Not so fast, cowboy. Our final group spent a total of 254 minutes on task, and THEY had two 45-minute periods scheduled each week also. What happened with this group was that they were scheduled to do the game in a computer lab and there was frequently a scheduling conflict so that time was spent locating an alternate site.
We had three groups that had 220, 254 and 255 minutes on task. Surely they would be comparable, no? In fact, the fourth-grade classroom that had 255 minutes on task had a standard deviation of 14 minutes, with a mean of 28. The class that had 254 minutes had a mean of 36 and a standard deviation of 31. Looking at the distribution overall by grade may help.

So, you can see that even though the mean for the fifth grade class was equivalent, the distribution was quite different. With all that running around the school to find a replacement room, over half of the sessions with this class ended up with 10 minutes of time on task.
My point is that these four classes were ALL supposed to be equivalent. The brilliant idea we had was to do a 2 x 2 ANOVA with group (control versus intervention) and grade level. However, as you can clearly see, there are more differences between the groups than grade. There are differences in the total number of minutes playing the game, the average time they were able to play it and probably a lot more.
I strongly suspect that this type of dilution and variation of the treatment effect happens ALL of the time. One could argue (and I would agree) that this is evidence of the need for mixed models with consideration of classroom as a random effect. I would argue even more, though, that this is also evidence of how useful it is to have a constant view of what is actually happening in our intervention, as opposed to what is SUPPOSED to be happening.