What’s all that factor analysis crap mean anyway? Part 1 of Several
My doctoral advisor, the late, great Dr. Eyman, used to tell me that my psychometric theory lectures were,
A light treatment of a very serious subject.
Hmph. Well, with all due respect to a truly wonderful mentor, I still have to state unequivocally that the majority of students when looking at a factor analysis for the first (or second or third) time are thinking more like the title of this post.
Several days ago,I described how to point and click your way through factor analysis so that you got a bunch of output. Now what?
The questions to answer are:
- What exactly is a factor anyway?
- How many factors are present in these data?
- What does each factor that you extracted represent?
Conceptually, a factor is some underlying trait that is measured indirectly by the items you measured directly. For example, I want to measure a factor of “mathematical aptitude”. So, I ask a bunch of questions like, “What is 7 x 6?” and “If two trains left the station at the same time, going 100 miles an hour in opposite directions, how far apart would they be 45 minutes later?” I’m really not that interested in your ability to answer that specific question about trains.
Factor analysis is also referred to as a ‘dimension reduction technique’. It’s much simpler to understand a relationship between, say college GPA and two factors of quantitative aptitude and verbal aptitude than to explain the correlations among 120 separate questions and college GPA.
The measures could be anything – test scores, individual items on a test, measurements of various dimensions like height or weight, agricultural measures like yield of a rice field or economic ones like family income. You’re factor analyzing a correlation matrix of these neasures (if your input data set was not a correlation matrix, it’s going to be transformed into one before it’s analyzed). Correlations are standardized to have a variance of 1.
One thing you want to look at is the eigenvalues. An eigenvalue is the amount of variance in the individual measures explained by the factor. (If you don’t believe me, square the loadings in the factor pattern and add them up. The total is the eigenvalue. Prediction: At least one person who reads this will do exactly that and be surprised that I am right. Contrary to appearances, I do not make this shit up.) So if the eigenvalue is 1.0 it has explained exactly as much variance as a single item. What good is that? It would take you 42 factors with an eigenvalue of 1.0 to explain all of the variance in a set of 42 measures. You’re not reducing the dimensions any. For that reason, a common criterion for deciding the number of factors is “Minimum eigenvalue greater than 1.”
The problem is, and it has been documented many times over, this criterion, although it is the default for many software packages, tends to give you too many factors. I prefer two other methods. My favorite is the parallel analysis criterion which does many iterations of analysis of a dataset of random numbers. The idea is you should get factors that explain more than if you analyzed random data. There is a useful SAS macro for doing that.
Or … you can just look at a scree plot, which, although not quite as accurate involves no more effort than staring. Here is my scree plot from the 42 variables I analyzed from the 500 family study. As every good statistician (and Merriam-Webster ) knows, scree is ” an accumulation of loose stones or rocky debris lying on a slope or at the base of a hill or cliff”. The challenge is to distinguish which factors should be retained and which are just showing small random relationships among variables, like the bits of rubble.
Clearly, we want to keep our first factor, with an eigenvalue of 7.3. Our second, with an eigenvalue of 3.3 looks like a keeper as well. So-o-o , do we take the third factor with an eigenvalue of 2.2 or do we say that is just part of the scree-type random correlations? I’m saying we keep it. Were you hoping for something more scientific? Well, I guess you’re disappointed, then.
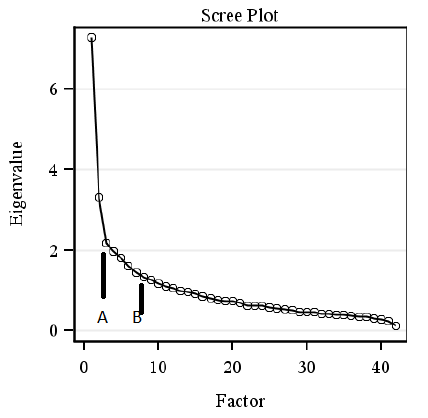
By the way, if we used the minimum eigenvalue of 1 criterion that would give us 12 factors which is just ridiculous. Liau et al. (2011) in a very serious paper for SAS Global Forum suggest not having less than 50% of the variance explained. That would mean your eigenvalues you keep add up to 21 at least, and not the 12.8 we have here (7.3 + 3.3 +2.2). To do that, instead of cutting the factors at our plot at 3, which I have so helpfully labelled Point A, we would instead cut it at Point B.
What we are doing now is an exploratory factor analysis so I am going to do this:
1. Based on my scree plot request a 3-factor solution.
2. Inspect the factor pattern and see if that makes sense to me based on expertise in the content area which I am going to pretend to have. (Actually, if you’re familiar with Baumrind’s work, it is looking a bit like the control / warmth factors that she postulated so I am not completely pulling this out of my — um, head.)
3. Run the parallel analysis macro and see the number of factors recommended by that.
Check back here next time I can get some time away from my day job writing computer games to pontificate on analysis of random data. Hopefully, that will be tomorrow because our (relatively) new Chief Marketing Officer is going to the women entrepreneur meet-up in Pasadena instead of me because I’d rather write about Kabacoff’s parallel analysis macro. And THAT is why I hired someone to do marketing.