Mama AnnMaria’s Point-y Click-y Guide to Factor Analysis
So, yesterday, if you were paying attention, we figured out WHY to do a factor analysis today’s post is about how. I’m using SAS Enterprise Guide because I had it open on my computer.
Here is what the completed project looks like:
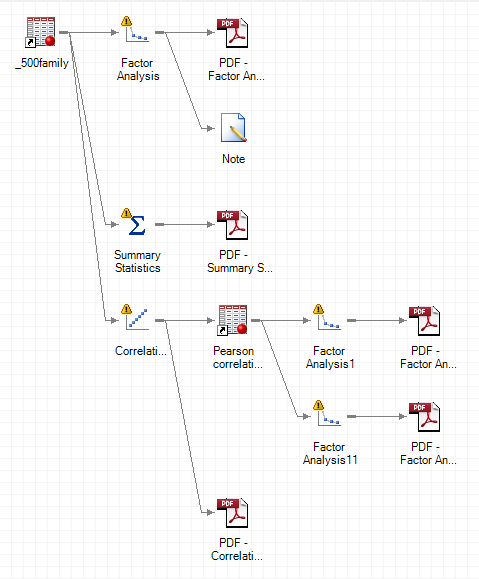
Here is what I did, reading from the top — I opened a data set, ran a factor analysis and looked at it. When I looked at it, I saw that over 120 of the records were missing out of less than 500 people. I made a note of this – literally.
Thing to know: the default for SAS is to delete a record if it is missing ANY of the variables.
Next, I ran summary statistics to see if maybe there was one that 200 people were missing, say it was about how much input parents have into your job choices and most of the kids did not work. If that had been the case, I could have just dropped that one variable. It wasn’t.
So… I ran correlations of all the variables and then I factor analyzed the correlation matrix (WAY easier than it sounds!)
After I took a look at the results from this analysis, I thought I could do better, so I re-analyzed the data requesting only three factors.
With the overview out of the way, let’s take a look at each part.
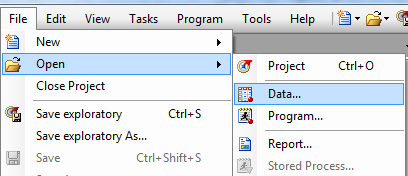
Open the data set is a piece of cake, go to File > Open > Data
 Select the data set you want, just like you open a file in Microsoft Word or anything else.
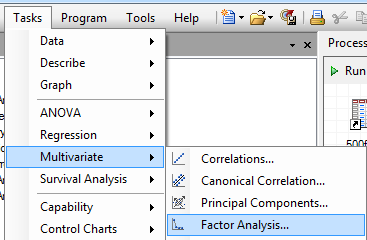
To do the Factor Analysis, click TASKS then MULTIVARIATE and then select FACTOR ANALYSIS
A window will pop up where you select the variables you want to use in the analysis
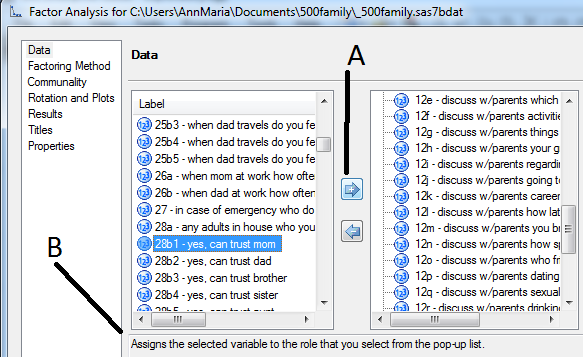
Click on a variable and then click the arrow which I have so helpfully labeled as “A”. Notice that SAS Enterprise Guide in the box I have equally helpfully labeled “B” often gives you tips on what you are supposed to do in a given situation. You’re welcome. You can hold down the shift key, and select a bunch of variables at once, too.
You can leave most of the defaults but I would strongly suggest that you change two of them under ROTATION AND PLOTS. Generally, you’ll find a rotated factor pattern easier to interpret. I usually start with ORTHOGONAL VARIMAX rotation, which assumes that your factors are unrelated. I always want a scree plot, so I check that. Then, click RUN.

When you get your results, do NOT look at your results first. Be smarter than most people and look at your log. To do that you click on the tab that says LOG
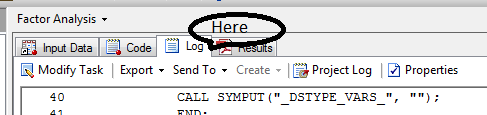
When you do, you see this:
WARNING: 123 OF 465 OBSERVATIONS IN DATA SET WORK.SORTTEMTABLESORTED OMITTED DUE TO MISSING VALUES.
If we didn’t have a lot of people missing data, we could skip the next few steps, but hey, that’s life. One of my big gripes about many statistics courses and textbooks is they pretend that data is always just pristine and perfect. There are very few times in real life that your data are like that, and this is not one of them.
So …. before going any further, I decide to look at the descriptive statistics for the data. Normally I look at this before any other analyses to make sure the data are not out of range, there aren’t people who show an age of 999 or who scored 99 on a scale of 1 to 10. There aren’t variables that were skipped by 90% of the sample. I did that with these data but since now I am missing over one-fourth of the sample, I decide to look again.
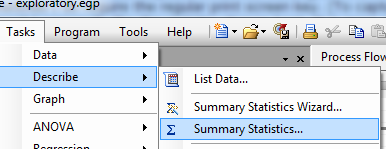
To get descriptive statistics using SAS Enterprise Guide, go to TASKS > DESCRIBE > SUMMARY STATISTICS
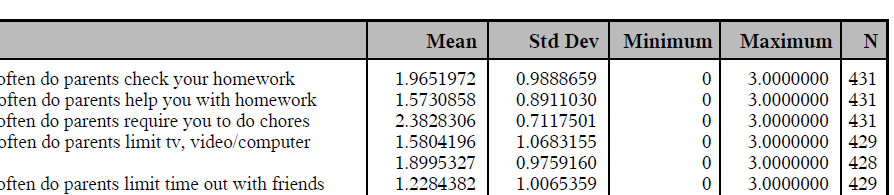
A window will pop up and just as you did above, select the variables you want to analyze. When I look at the results, I can see that the data are fine. The variables are on a 0 (=Never) to 3 (=often) scale and that all looks right. The sample size is 431, 428, 429, 415. In other words, for each question, a few people overlooked it or skipped it, but if you add all of those people who missed one here or there together it comes out to 123 people.
Here is where you can factor analyze the correlation matrix. You see, a factor analysis is a look at which items on a questionnaire are related. We hope to find a group of items that are related to each other and then put them into a scale of say, parental supervision. What else looks at whether a bunch of items are related? Why, a correlation matrix.
Because I should get some actual work done for money, I’ll talk about how to do that in my next post, unless some other shiny thing catches my eye and I decide to write about something else.
=================================================
Learn math. Save lives. Learn culture. Kill animals. (Relax, it’s a game.)

3 Comments