PROC FREQ for data analysis (sort of)
Previously, I discussed PROC FREQ for checking the validity of your data. Now we are on to data analysis, but, as anyone who does analysis for more than about 23 minutes can tell you, cleaning your data and doing analysis is seldom a two-step process. In fact, it’s more like a loop of two steps, over and over.
First, we have the basic.
PROC FREQ DATA = mydata.quizzes ;
TABLES passed /binomial ;
RUN;
(NOTE: If you have a screen reader, click here to read the images below. This is for you, Tina! )
This will give me not only what percentage passed a quiz that they took,
but also the 95% confidence limits.
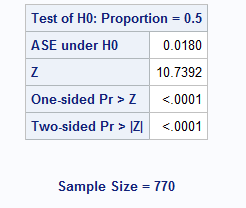
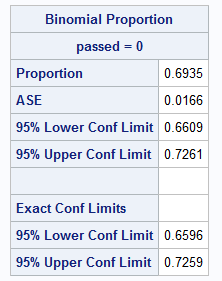 This also gives a test of the null hypothesis that the population proportion equals the number specified. If, as in this case, I did not specify any hypothesized population value, the default of .50.
I didn’t have any real justification for hypothesizing any other population value. What proportion of kids should be able to pass a quiz that is ostensibly at their grade level? Half of them – as in, the “average” kid? All of them, since it’s their grade level? I’m sure there are lots of numbers one could want to test.
If you do have a specific proportion, say, 75%, you’d code it like this:
PROC FREQ DATA =in.quizzes ;
TABLES passed / BINOMIAL (P=.75);
Note that the P= has to be enclosed in parentheses or you’ll get an error.
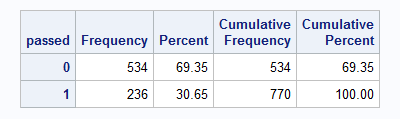
So, out of the 770 quizzes that were taken by students, only 30.65% of them passed. However, the quizzes aren’t all of equal difficulty, are they? Probably not.
So, my next PROC FREQ is a cross-tabulation of quiz by passed. I don’t need the column percent or percent of total. I just want to know what percent passed or failed each quiz and how many players took that quiz. The way the game is designed, you only need to study and take a quiz if you failed one of the math challenges, so there will be varying numbers of players for each quiz.
PROC FREQ DATA =in.quizzes ;
TABLES quiz*passed /NOCOL NOPERCENT ;
The first variable will be the row variable and the one after the * will be the column variable. Since I’m only interested in the row percent and N, I included the NOCOL and NOPERCENT options to suppress printing of the column and total percentages.
(For an accessible version for screen readers, click here)
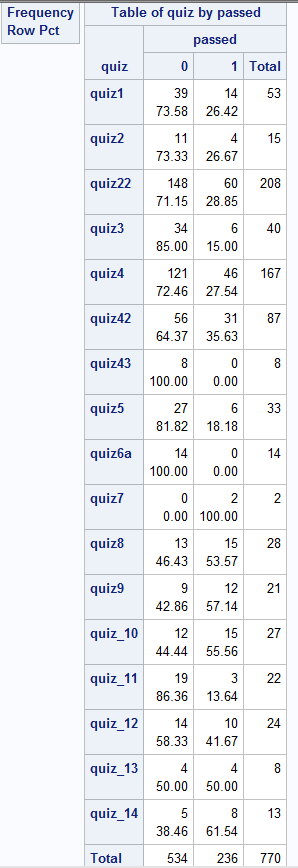
Before I make anything of these statistics, I want to ask myself, what is going on with quiz22 (which actually comes after quiz2) and quiz4? Why did so many students take these two quizzes? I can tell at a glance that it wasn’t a coding error that made it impossible to pass the quiz (my first thought), since over a quarter of the students passed each one.
This leaves me three possibilities:
- The problem before the quiz was difficult for students, so many of them ended up taking the quiz (another PROC FREQ)
- One of the problems in the quiz was coded incorrectly, so some students failed the quiz when they shouldn’t have,
- There was a problem with the server repeatedly sending the data that was not picked up in the previous analyses (another PROC FREQ).
Remember what I said at the beginning about data analysis being a loop? So, back to the top!
————–
If you’d like to see the game used to collect these data, even play the demo yourself, click here.

Hi AnnMaria,
For displaying results like your last table I like to do something like this. Each quiz is on its own row, so the table seems easier to read.
PROC MEANS DATA =in.quizzes SUM MEAN;
CLASS QUIZ;
VAR passed;
RUN;
Thanks for the idea, Andrew. Hopefully I’ll get five minutes away from meetings this week to try that.