Explaining Statistics for the Very First Time
When I first taught multivariate statistics, I was nervous. The material is more difficult than Statistics 101 so I assumed teaching the course would be more difficult as well. Over 25 years of teaching, I’ve found the opposite. The more advanced you get in a field, the easier the courses are to teach. You might expect it is because you have more motivated or capable students, and there is some of that effect. A bigger effect, I’ve found, is because once students have the basic concepts you have something to generalize from. Also, you have a common vocabulary. It’s much easier to explain that multiple regression is just simple regression with multiple predictor variables than to explain what regression is to someone who has never been exposed to the concepts of correlation and regression.
I’m in the middle of making a game to teach statistics to middle school students and was thinking how to explain to them why what they are learning is important and how to explain statistics to someone who has never been exposed to the idea. On top of this challenge is the fact that I know many of the students playing our games will be limited in English proficiency, either because it is their second language or simply because they have a limited vocabulary.
Why learn statistics? Did you even know that the type of mathematics you are learning at the moment has its own name? If you did, pat yourself on the back for being smart. Go ahead, I’ll wait.
Statistics is the practice or science of collecting and analyzing numerical data in large quantities, especially for the purpose of making inferences.
We’re going to break down that definition.
Collecting numerical data.
Collecting: bringing or gathering together. Notice people don’t have a collection of one thing!
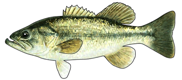
Numerical: Numbers that have meaning as a measurement. The fact that 1 bass can feed 2 people is numerical data.
Data : Facts or figures from which conclusions can be drawn
Analyzing: looking at in detail, examining the basic parts – like looking at each category of animal and how many people it can feed
Let’s take the example of the Mayans hunting, using this graph that shows how many people you can feed with each type of animal.
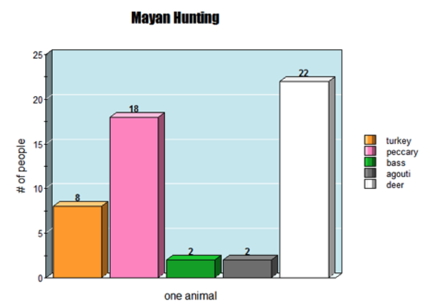
Based on the data that you have, you know you can feed more people from a peccary, than a bass, so you could draw the conclusion that an area with a lot of peccaries would be a better place to be looking for food than one with a lot of bass.
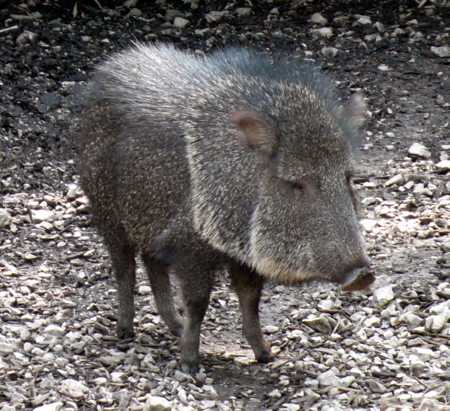
This is what a peccary looks like, in case you were wondering.
Here is what is important to know about the science of collecting and analyzing numerical data – you are making decisions based on facts.
Why on earth would you hunt peccary? They can be dangerous if threatened, and trying to kill one and eat it is certainly threatening it.
On the other hand, no one ever got injured by a bass, as far as I know.
 As you can see from the graph above, you can feed 9 times as many people from a peccary, so maybe it is worth the risk.
You’re just learning to be a baby statistician at this point, working with really small quantities of data.
The same methods using bar graphs, computing the mean and analyzing variability are used everywhere with huge amounts of data. The military uses statistics, for everything from figuring out how many tanks they need to order to deciding when to move soldiers from one part of the country to another. One of the first uses of statistics was for agriculture, to decide what was working to raise more corn and what wasn’t. You’ll get to see for yourself when you get to the floating gardens of the Aztecs.
—–
Here’s my question to you, oh reader people, what resources have you found useful for teaching statistics? I mean, resources you have really watched or used and thought, “Hey, this would be great for teaching? ”
There is a lot of mediocre, boring stuff on the interwebz and if any of you could point me to what you think rises above the rest, I’d be super appreciative.
—–
 If you want to check out our previous games, that teach multiplication and division (Spirit Lake) or fractions (Fish Lake) you can see them here. If you buy a game this month you can get our newest game, Forgotten Trail (fractions and statistics) as a free bonus.
Love your blog! as far as a resource, i would say Brandon Foltz channel on youtube is a great one for learning Statistics