2 tips to being a better programmer, if you can’t afford SAS Global Forum
I did a random sample of presentations at SAS Global Forum today, if random is defined as of interest to me, which let’s be honest, is pretty damn random most of the time.
Tip #1 Stalk Interesting People
I don’t mean in a creepy showing up at their hotel room way. If you see someone presenting either in person or referenced in twitter, blogs, etc. , check out what else that person has freely available on the web, in published proceedings, etc.
Let me give you an example that applies even if you are not into logistic regression. (You’re not? Feel shame.)
The first session I attended was a Super Demo in the exhibit hall which for some reason I don’t understand is always called the Quad.
In a nutshell, logistic regression is usually
- binary, which is where I started out, modeling mortality studies, you’re either dead or alive
- multinomial, that is, multiple categories, like college major or religion or
- ordinal , like someone is a subscriber, contributor, editor or administrator on a group blog, which are progressively higher levels of involvement
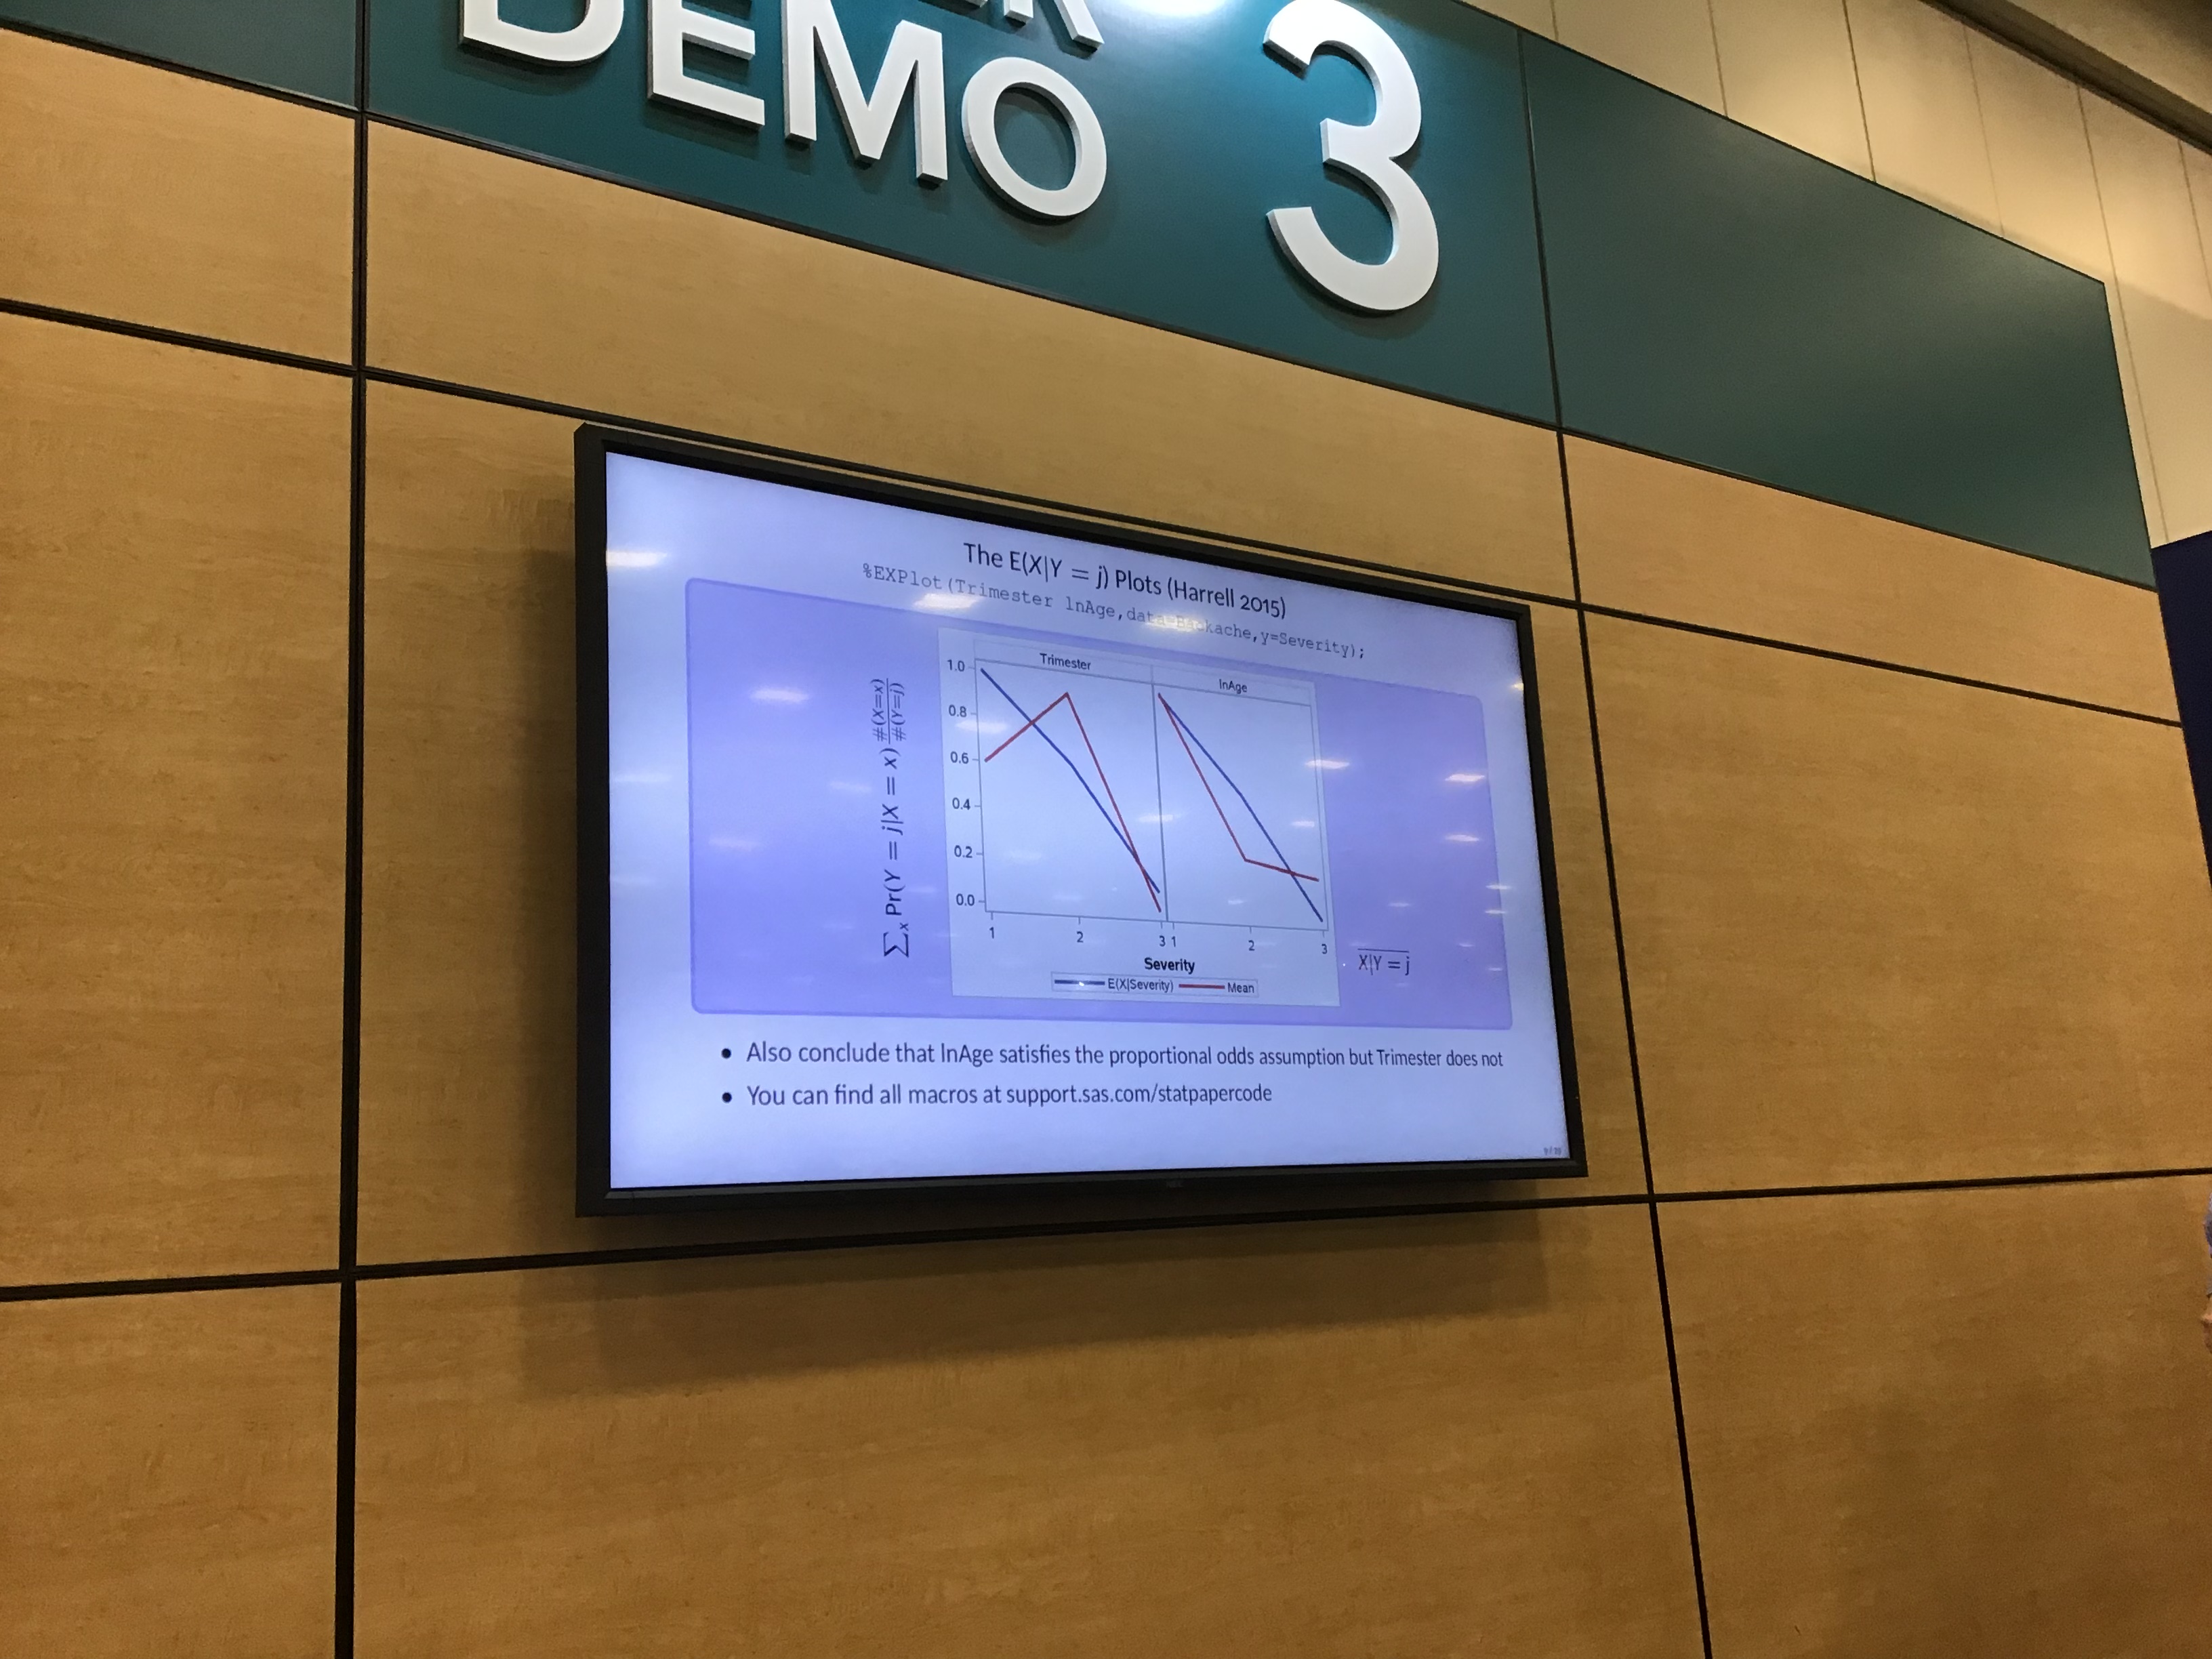
What if the data fit the proportional odds model for some of the explanatory variables and not others? You can do a partial proportional odds model.
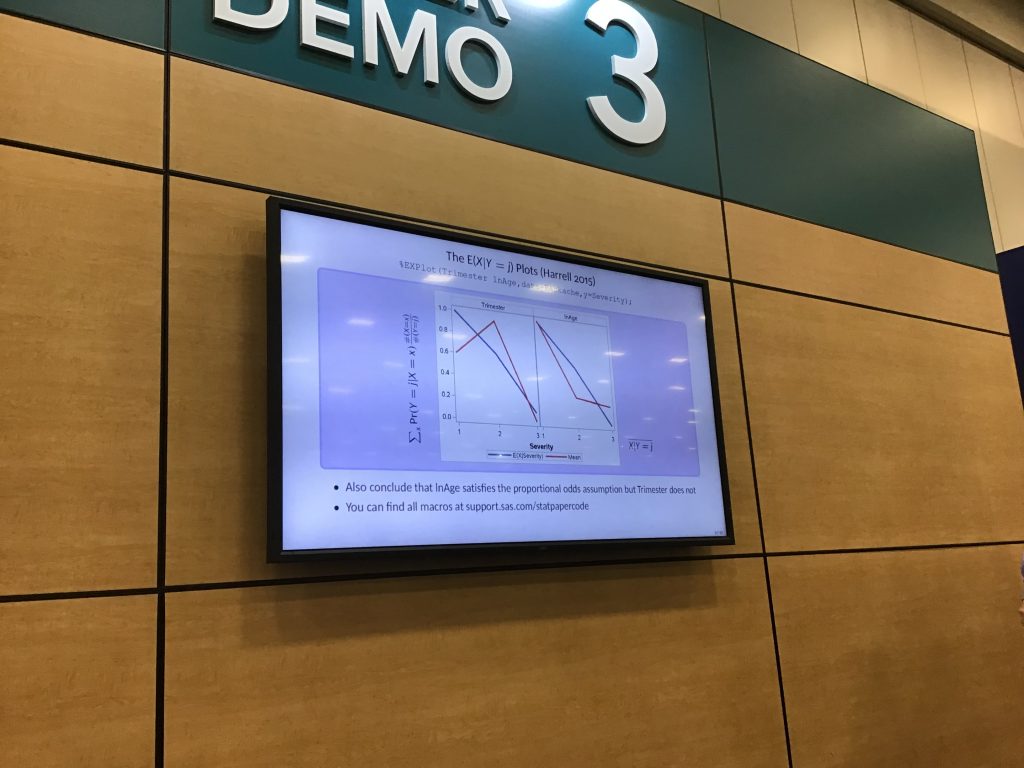
Unfortunately, the super demos do not have a paper published in the app or proceedings, however, the presenter, Bob Derr from SAS mentioned he had presented a paper on this topic in 2013 (way to play hard to get, Bob – not!)
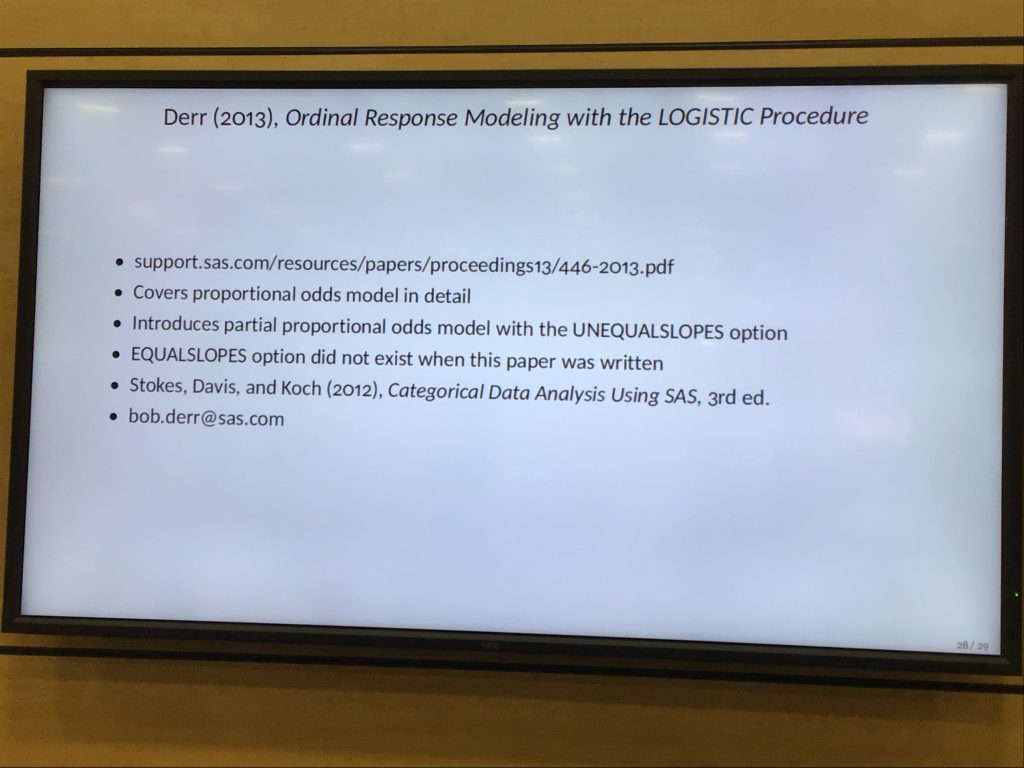
I skipped the next presentation to read it (and to write this post). If you are at all interested in multinomial and ordinal logistic regression, you should, too. You can find it here in the SAS Global Forum 2103 proceedings. http://support.sas.com/resources/papers/proceedings13/446-2013.pdf
It’s an outstanding paper and I am going to require it for my course next year. I think the students will find it far more accessible than some of the readings we have been using. They don’t complain loudly, but I know, I know.
Tip #2 Read the Documentation (No, seriously, keep reading)
People who answer comments with LMGTFY (let me Google that for you) or RTFM (read the fucking manual), just so you know, that quit being funny around 1990. However, SAS documentation really is a treasure trove. It’s not just SAS, the same could be said about jQuery documentation or the WordPress Codex but we’re not talking about those today, are we? Please try to stay on topic.
The SAS documentation runs many, many thousands of pages. It’s far better and more detailed than you would think. Let me give you an example a very helpful person named Michael pointed out in the Quad (what the hell is it with that name?) today. As I’ve mentioned several times lately, my students often struggle with repeated measures ANOVA. He suggested checking out the page on longitudinal data analysis.
http://support.sas.com/rnd/app/stat/procedures/LongitudinalAnalysis.html
It gives four different procedures (none of which are GLM, I noted, but that’s a discussion for another day).
Related to that, I recommend when you are learning procedures just running some of the code examples. For example, here is one for repeated measures with PROC MIXED. http://documentation.sas.com/?docsetId=statug&docsetTarget=statug_mixed_examples02.htm&docsetVersion=15.1&locale=en. (Yes, I really do have that on my mind lately)
Think about this, though. Once you graduate from whatever your last degree turns out to be, you don’t have anyone checking your work and telling you if it is right or not. You just write your code and hope for the best. That sucks, huh?
When you are learning a new procedure, you can write code using the data shown in the SAS documentation and see if your results match. Like an answer key for life! I always wanted one of those.
Good call on this resource. Derr’s paper is breathtakingly important for any analyst.