Matrix of plots with SAS
When I was running out to the airport, I said I would explain how to get a single plot of all of your scatter plots with SAS. Let’s see if I can get this posted before the plane lands. Not likely but you never know …
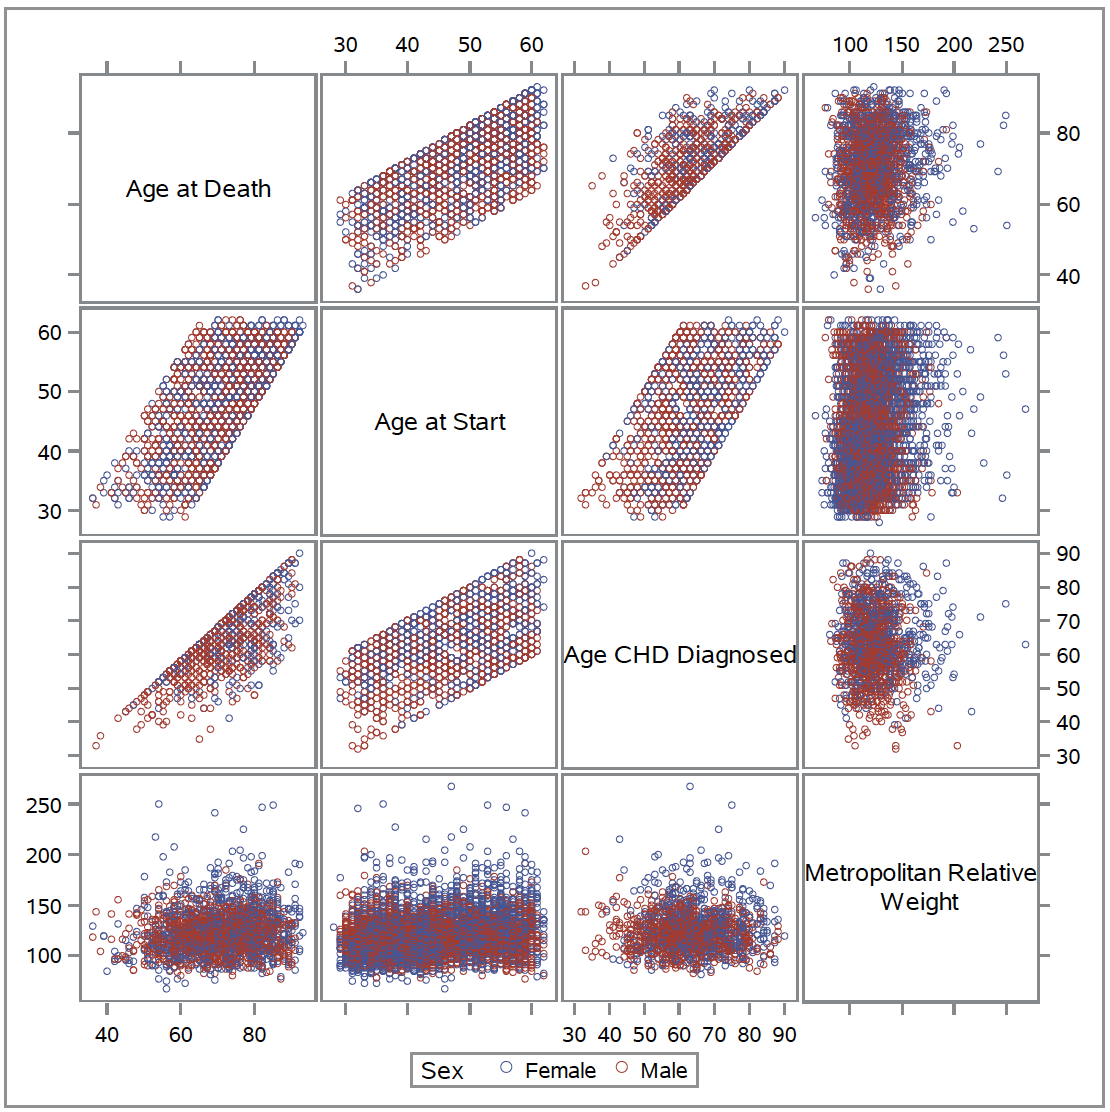
It’s super simple
proc sgscatter data=sashelp.heart ;
matrix ageatdeath ageatstart agechddiag mrw / group= sex ;
And there you go.
Statistical graphics from 10,000 feet. Is this a full service blog or what?