Simple graphs, not so simple answers
The truth is, what I wanted to be talking about today was either data mining, text mining or mixed models. Those are three things I want to be doing more and would be doing more except that we have a Kickstarter campaign going on to fund the next six levels of our game that teaches math, which really is awesome < Seriously, it is .
So, even though I was feeling statistically deprived these days, I have to admit that sometimes simple statistics do give you pretty straight answers. Let’s take the test we created to see whether this game really works to improve students’ math scores. This is what we used to measure the effectiveness of the game in our pilot phase. Our original idea was to take released items from the state standards test. Turns out that North Dakota, where we piloted the game, is one of the states that never releases the items on its tests. So … we found other states that had identical standards, like, “Solve problems involving division of multi-digit numbers by one-digit numbers.”
Then we took questions released from those tests, like:
6. Valerie has 225 pennies. She divides her pennies into five equal piles. How many pennies are in each pile?
40
45
50
55
and created our test aligned to state standards. That is good for content validity – that is our test matches the content teachers were supposed to be teaching. When we look at the percentage of each item answered correctly by grade level, we see two things.
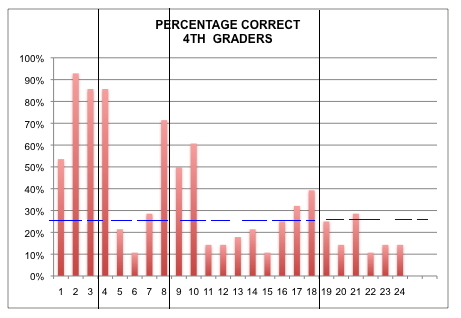
First, if you look at those vertical lines, after the third, eighth and eighteenth questions, those are grade level. As I wrote about previously, this gives us some evidence for contract validity given that fourth-grade students answer most questions at the second grade level correctly, and relatively few at the fourth and fifth-grade level. (Because this was a low-performing school on other criteria, we expected many students to be below grade level.)
Notice the dashed horizontal line I added, though. That is at 25%. If students just randomly guessed, they would get 25% correct. Many of those who got those items “correct” , I would suppose just guess. This introduces random error and makes your results less reliable. Now correction of scores for guessing is not new. Frary, Cross and Lowry published an interesting article on the topic and how it affects reliability in the Journal of Experimental Education back in 1977 and there has certainly been plenty of discussion since.
Still, it would be much better to NOT have to correct. Looking at these charts was one thing that really convinced me to switch from a multiple choice to fill-in-the-blank format. Since the tests are taken on line there is no more effort to score if we use this method. Of course, that does mean we are not going to be using the exact same items as the state tests, and, in fact, ours will be a bit harder. That’s okay, though, since we are comparing pre-test to post-test and not to any of the multiple choice tests administered for the states. Looking at these graphs was one of the factors that confirmed my decision to rewrite that part of the game using PHP and JavaScript instead of using a commercial service – Surveymonkey. Since we only had eight months total to write the game, pilot it in the schools and write up the analyses, we went with some pre-fabricated solutions, but now that phase is over, we are going back and revising parts of the design more to what we would like in an ideal situation. It’s really the point of a prototype.
Also interesting to me, notice how many questions are BELOW that line of 25%. Why do you think that is? Are Native American kids just bad guessers? I know the answer to that question, but put your guesses in the comments and I’ll tell you on Friday.
We don’t often have multiple-choice tests in UK maths education – in fact: students are given partial credit for communicating a correct method.
You’ve left me with a super-interesting stats puzzle! I’m not confident of an obvious solution, but here are some suggestions 🙂
– Assuming people are guessing randomly, the mean of random guesses should be 25% in the population – however, we expect to see some variation from 25% in the sample you’ve collected. Depending on the number of students you tested these results might not be unusually low.
– If students are not required to guess, and are not confident, they probably won’t guess at all. I see this even at a much higher level and even if there is no penalty for a bad guess: people don’t like to be seen to be wrong.
– Students could be guessing non-randomly, with some (unhelpful) knowledge. Especially if the tester can predict what misconceptions students will have: ‘red herring’ wrong answers could produce percentages below 25%.
I’m not sure if Question 6 is set up like this, but – for example – a student who is not sure might think “it seems fivey” and guess 55.
With a fairly small sample, the variance from your expected number of randomly correct answers will vary pretty significantly, leading to questions with correct percentages above and below 25%.
I think Ronald’s on to something: the worse-than-random-guessing scores probably come from people who leave questions blank.