Plotting Agreement with Kappa Plots from PROC FREQ
In assessing whether our Fish Lake game really works to teach fractions, we collect a lot of data, including a pretest and a post-test. We also use a lot of types of items, including a couple of essay questions. Being reasonable people, we are interested in the extent to which the ratings on these items agree.
To measure agreement between two raters, we use Kappa’s coefficient. PROC FREQ produces two types of Kappa coefficients. The Kappa coefficient ranges from -1 to 1, with 1 indicating perfect agreement, 1 indicating exactly the agreement that would be expected by chance and negative numbers indicating less agreement than would be expected by chance . When there are only two categories, PROC FREQ produces only the Kappa coefficient. When more than two categories are rated, a weighted Kappa is also produced which credits categories closer together as partial agreement and categories at the extreme ends as no agreement.
The code is really simple:
ODS GRAPHICS ON;

PROC FREQ DATA =datasetname ;

TABLES variable1*variable2 / PLOTS = KAPPAPLOT;

TEST AGREE ;
Including the ODS GRAPHICS ON statement and the PLOTS = KAPPAPLOT option in your TABLES statement will give you a plot of both the agreement and distribution of ratings. Personally, I find the kappa plots, like the example below, to be pretty helpful.
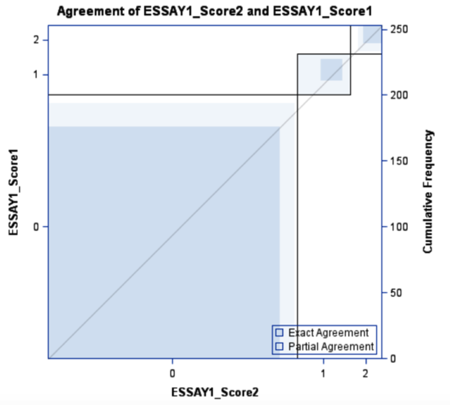
This visual representation of the agreement shows that there was a large amount of exact agreement (dark blue shading) for incorrect answers, scored 0, with a small percentage partial agreement and very few with no agreement. With 3 categories, only exact agreement or partial agreement is possible for the middle category. Two other take-away points from this plot are that agreement is lower for correct and partially correct answers than incorrect ones and that the distribution is skewed, with a large proportion of answers scored incorrect. Because it is adjusted for chance agreement, Kappa is affected by the distribution among categories . If each rater scores 90% of the answers correct, there should be 81% agreement by chance, thus requiring an extremely high level of agreement to be significantly different from chance. The Kappa plot shows agreement and distribution simultaneously, which is why I like it.
———
Want to play the game ? You can download it here, as well as our game for younger players, Spirit Lake.
One Comment