Filter Data with SAS Enterprise Guide: Even More Useful than You Think
Occasionally, a brave student will ask me,
When will I ever use this?
The “this” can be anything from a mixed model analysis to nested arrays. (I have answers for both of those, by the way.)
I NEVER get that question when discussing topics like filtering data, whether for records or variables, because it is so damn ubiquitous.

Before I headed out to be, literally, testing in the field (you can read why here) , I was working on an evaluation of the usability of one of our games, Fish Lake.
My next thought was that many students played the game for a very short time, got the first answer correct and then quit. I decided to take a closer look at those people.
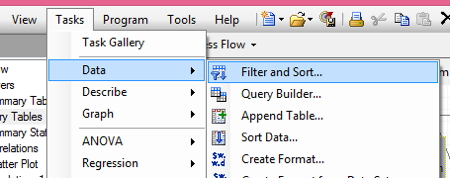
First step: from the top menu select TASKS, then DATA, then FILTER AND SORT
Second step: Create the filter. Click on the FILTER tab, select from the drop-down menu the variable to use to filter, in this case the one named “correct_Mean” , select the type of filter in the next drop-down menu, in this case EQUAL TO and in the box, enter the value you want it to equal. If you don’t remember all of the values you want, clicking on the three dots next to that box will bring up a list of values. You can also filter by more than one variable, but in this case, I only want one, so I’m done.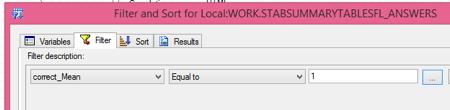
Third step: Select the variables. Steps two and three don’t have to be done in a particular order, but you DO have to select variables or your procedure won’t run, since it would end up with an empty data set. I do the filter first so I don’t forget. I know the filter is the whole point and you’re probably thinking you’d never forget that but you’re probably smarter than me or never rushed.
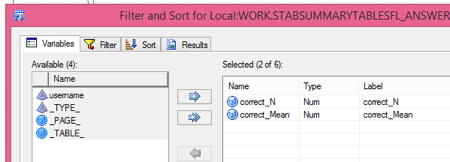
If you click the double arrows in the middle, that will select all of the variables. In this case, I just selected the two variables I wanted and clicked the single arrow (the top one) to move those over.
Why include correct_mean, since obviously that is a constant?
Because I could have made a mistake somewhere and these aren’t all with 100% correct. (Turns out, I didn’t and they were, but you never know in advance if you made a mistake because if you did then you wouldn’t make it.)
I click OK and now I have created a data set of just the people who answered 100% correctly.
For a first look, I graphed the frequency distribution of the number of questions answered by these perfect scorers. To do this,
- Go to TASKS > GRAPH > Bar Chart
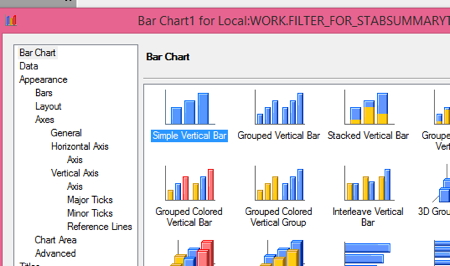
2. Click on the first chart to select it, that’s a simple vertical bar chart
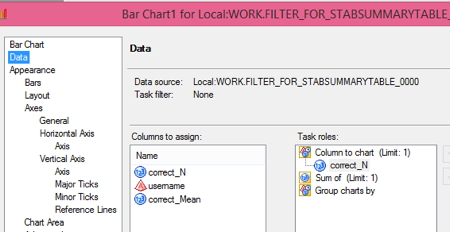
3. Click on the DATA tab and drag correct_N under column to chart
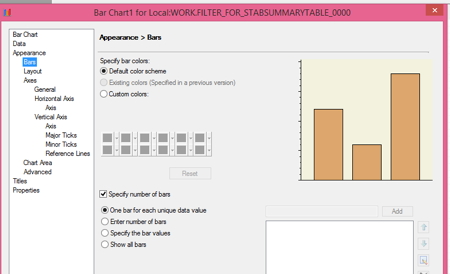
4. Under APPEARANCE click the box next to SPECIFY NUMBER OF BARS. The default here is one bar for each unique data value, which is already clicked. Caution with this if you might have hundreds of values, but I happen to know the max is less than 20.
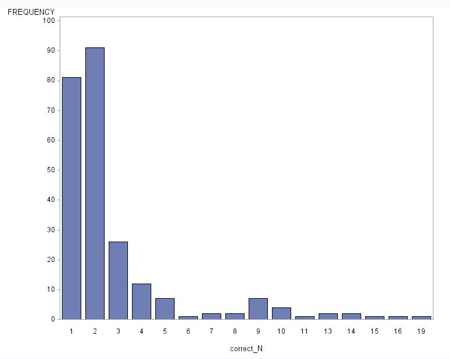 I thought I’d find a bunch answered one question and a few answered all of the questions and maybe those few were data entry errors, say teachers who tested the game and shouldn’t be in the database. When I look at this graph, I’m surprised. There are a lot more people who had answered 100% correctly than I expected and they are distributed a lot more across the number of questions than I expected. That’s the fun of exploratory data analysis. You never know what you are going to find.
SO, now what?
Want to see the game that generated these data? Canoe rapids, catch fish and learn fractions.

So, now what?
I want to find out more about the relationship among persistence and performance. To do this, I’m going to need to merge the answers summary data set with demographics.
I’m going to go back to the Summary Data Set I created in the last post (remember that one) and just filter variables this time, keeping all of the records.
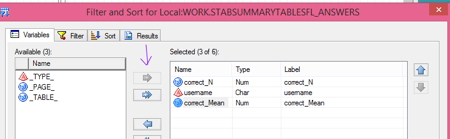
Again, I’m going to go to the TASKS menu, select DATA then FILTER AND SORT, this time, I’m going to have no filter and select the variables.
Since the pop-up window opens with the VARIABLES tab selected, I just click the variables I want, which happens to be “correct_N”,” correct_mean” and “username”, click the single arrow in between the panes to move them over, and click OK at the bottom of the pop-up window. Done! My data set is created.
You can always click on PROGRAM from the main menu to write code in SAS Enterprise Guide, but being an old dinosaur type, I’d like to export this data set I just created and do some programming with it using SAS. Personally, I find it easier to write code when I’m doing a lot of merging and data analysis. I find Enterprise Guide to be good for the quick looks and graphics but for more detailed analysis, the old timey SAS Editor is my preference. If you happen to be like me, all you need to do to output your data set is click on it in the process flow and select EXPORT.
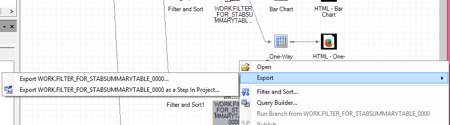
You want to export this file as a stand-alone data set, not as a step in a project. Just select the first option and you can save it like any file, select the folder you want, give it the name you want. No LIBNAME statement required.
And it’s a beautiful sunny day in Santa Monica, so that’s it on this project for today.
—–
2 Comments